What window/resolution settings do you typically use for acoustic measurement of a speaker?
Using a borrowed Clio to run some tests with woofer in cabinet paired with AMT Heil, I need advice re: which settings will give results dependable for going forward with crossover designs.
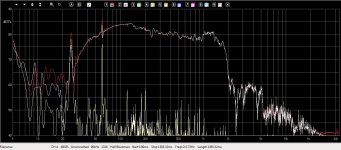
I find that changing the resolution nets very different results for FR or Z in sine sweeps and also that when using Log Chirp or MLS , window type (Rectangular, Hanning , Hanning/2, Blackman & Blackman/2 ) and size settings (16K and 128K in these images) also nets different results for Log Chirp and MLS though no other changes are made to to the system set-up.
Particularly in the last image for sine sweep of a small horn (18sound XT120), the differences between 1/6 Octave and 1/48 Octave make me disbelieve both. (top two traces are FR and bottom two are THD)
Any pointers on most reliable settings to use in general would be greatly appreciated.
Thanks
Using a borrowed Clio to run some tests with woofer in cabinet paired with AMT Heil, I need advice re: which settings will give results dependable for going forward with crossover designs.
I find that changing the resolution nets very different results for FR or Z in sine sweeps and also that when using Log Chirp or MLS , window type (Rectangular, Hanning , Hanning/2, Blackman & Blackman/2 ) and size settings (16K and 128K in these images) also nets different results for Log Chirp and MLS though no other changes are made to to the system set-up.
Particularly in the last image for sine sweep of a small horn (18sound XT120), the differences between 1/6 Octave and 1/48 Octave make me disbelieve both. (top two traces are FR and bottom two are THD)
Any pointers on most reliable settings to use in general would be greatly appreciated.
Thanks
Attachments


Last edited:
The correct window (in ms) needs to be applied by assessing the distance to the nearest (reflecting) surface to the speaker. If this is not done, the results would be largely unreliable. If the window time is not long enough (to give good resolution) then you may also have to increase the distance to the nearest surface by moving the loudspeaker etc.

The response plots look quite similar to me (on my phone right now). So apart from HD spectrum differences that seem to be partly outside the pass band, what is your concern?
Thanks very much for your replies. I do see that the traces for MLS and LogChirp are similar but below 50Hz I thought they differed more than they should, and when doing the sine sweeps the differences at the two different resolutions makes me wonder what I might be doing wrong.
I re-posted the last pic in the sequence above with labelling to show what I mean. (The two colours in the 1/48 Frequency Response trace is the result of thinking the first result was a test burp and doing another sweep to confirm. )
In an impedance test (which uses the sine sweep window in Clio), changing the /octave resolution made for a change in the resulting impedance at peak ranging from 60 Ohms to 130 Ohms. This is what started me doubting it was as simple as point and shoot. (I just ran another, attached here with similar results. Ranging from 1/3 to 1/96 Octave the impedance is higher with greater resolution (or if at same resolution it's higher at slower speed of sweep.)
WIth the four functions of basic arithmatic ,I know only enough to get myself in trouble. I have always had to rely on reiterative poking and trying stuff to get back out. I am hoping that with a rudimentary understanding of what icons to click on, I could use this (for now borrowed) Clio to up my game a little.
Attachments

Last edited:
D
Deleted member 375592
If you are going to average (=smooth) raw impedance readings over either -say- 1/12 or 1/1 octave, it's pretty obvious curves will differ. And for measuring low frequencies you'll need adequate (long) time windows or enough samples (big block size), because otherwise you won't measure the full wave envelope. These days people sometimes forget that higher sample rates aren't very useful for low frequency measurements. In general 48k is enough for speaker measurements and it enables long integration times without excessive amounts of samples.In an impedance test (which uses the sine sweep window in Clio), changing the /octave resolution made for a change in the resulting impedance at peak ranging from 60 Ohms to 130 Ohms.
Btw the picture you refer to doesn't make much sense to me, apart from the idea that two of the four plots could be representing actual data.
Will do , Thanks !Try watching some introductory YouTube videos on non-parametric spectral analysis
That's exactly the sort of infomation I was hoping for . I haven't figured out the reasons for choosing Rectangular, Hanning , Hanning/2 etc but apparently for speakers at any rate, the relative levels in a single trace are what's important.These days people sometimes forget that higher sample rates aren't very useful for low frequency measurements. In general 48k is enough for speaker measurements and it enables long integration times without excessive amounts of samples.
I had the microphone pointed at a small horn and swept for frequency response at two resolutions 1/6 Octave and 1/48. Nothing else was changed. The two uppermost traces are FR and they clearly are entirey different.Btw the picture you refer to doesn't make much sense to me,
The two lower traces are THD . The orange arrow is pointing to the THD trace at 1/6 but that trace is almost invisible as the dark blue doesn't show well in the jpeg for some reason. (The test indicated with orange is the one shown in the previous image (Labeled 1inCD-18Sound Horn). I'll put them both here.
Thanks again.
Attachments


Window shapes like rectangular, Hamming and others are used for two things, both apply in the time domain. First, with periodic signal measurements like MLS or periodic noise (ARTA) you need a window shape for the measurement in which you define how the start and stop of every period in the measurement signal have to be weighted. IIRC Clio uses MLS-signals, if not: this doesn’t apply to swept-sine measurements. Well, it does in a way but I don’t think Clio has user input for this. Sadly I’m not familiar with it.
Second you need a window shape for your (imaginary) time window on the calculated impulse response, for about the same reason: you have to weigh mainly the end of the impulse in order not to create strange artifacts when calculating the response curve.
With both you would not pick rectangular, but a Hamming, (half)Hann or Tukey 0,5 will do fine when using normal windows around 5ms. The app REW shows you the different weighing shapes in a very elegant way (IR window pane on a performed measurement) and you can experiment with the different settings.
Thanks all for your help. I've learned some things I can keep in mind here.
I also repeated the measurement for the CD on Horn and trying just about everything I could think of found that the trace labelled in green as 1/48 Octave must have had the mic turned off as turning it off again this time netted very close results. So another thing learned.
Thanks again !
I also repeated the measurement for the CD on Horn and trying just about everything I could think of found that the trace labelled in green as 1/48 Octave must have had the mic turned off as turning it off again this time netted very close results. So another thing learned.
Thanks again !
- Home
- Loudspeakers
- Multi-Way
- Acoustic Measurement: Choosing Window and Resolution: request advice