The terminal impedance will be larger at higher frequencies, than without the inductor.
Or mathematically, instead of R/2, the terminal impedance will be: R x ( R + sL ) / ( 2R + sL)
Note that if L = 0, the formula reduces to R/2, as it should.
And if L -> infinity, the formula reduces to R, as it should.
Of course a real inductor will also have series resistance as well as inductance.

That would get a little messy when done in a text editor.
But you can use Spice, etc.
Probably you'd want to use an RC correction network across the terminals to make the input impedance of the pair resistive.
Then the standard second order LP crossover formula would work.
But you can use Spice, etc.
Probably you'd want to use an RC correction network across the terminals to make the input impedance of the pair resistive.
Then the standard second order LP crossover formula would work.
Excuse me, but whether this formula needs a Laplace Transform for solving it.R x ( R + sL ) / ( 2R + sL) = Z
Once you have the complete s domain transfer function T(s), you can find the steady state sine wave frequency response.
To get T(w) substitute s = jω, where ω = 2Pi x f
Then the sine wave magnitude response is sqrt [ T(ω) x T(ω)* ] where T(ω)* is the complex conjugate of T(ω).
The sine wave phase response is arctan [ IM(T(ω)) / RE(T(ω)) ]
where IM(T(ω)) is the imaginary part of T(ω) and RE(T(ω)) is the real part.
No reverse transform is necessary, just some algebra.
One way would be to use VituixCAD.And how do we calculate the crossover network for them assuming a second-order filter, L2 and C3, is used?
View attachment 1321840
Below is a model of the above circuit. I've gone and chosen some representative values. The drivers are each a pure 8-ohm resistance, and they have a flat frequency response in the 5Hz to 40kHz limited simulation bandwidth supported by VituixCAD.
The resulting summed response (black line) is shown in the frequency response plot below. The filtered responses of drivers D1 and D2 are also presented (I was unable to change their individual colors for some unknown reason; any assistance would be welcome).
The resulting impedance curve is shown below. Notice how we have a 4-ohm load below about 100 Hz, as the two 8-ohm drivers are connected in parallel.
Assuming you're not on OSX (in which case an emulator will be needed), how about simulating it for yourself with one of the several free software programmes out there e.g VituixCAD (as above) XSim, PCD, WinPCD? That way, you can try all this and many more things for yourself.Typically, two 8-Ohm drivers connected in parallel will give 4 Ohms of impedance (and resistance) on the speaker terminal.
If the paralleling driver is inserted by an inductor, L3, how will the impedance (and resistance) be seen/measured at the terminal?
View attachment 1321833
Colors are linked to the drivers, so if you want different colors you have to add another driver (D2) with the same frd/zma files of D1. If you simply copy the driver in the crossover tab - like you did - you will have D1 twice.I was unable to change their individual colors for some unknown reason
This formula is already in the s domain. It has already been transformed from a PDE.whether this formula needs a Laplace Transform for solving it.
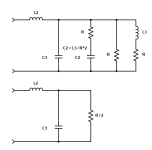
The impedance across the terminals of the circuit in post #1, can be made to appear like a resistor equal to R/2
(with R = the impedance of both drivers), by adding a series RC across the input terminals of the circuit.
The resistor of the series RC is equal to R, and the C of the series RC network is equal to L3/R^2.
Then use the second order filter circuit in post #3 with a resistor equal to R/2 in place of the circuit in post #1 with the RC network. So you have L2, C3, and R/2 for the circuit, and the standard formula (or calculator) can be used.
From this, you would likely want to use only 8 ohm drivers for both woofers.
The two circuits in the diagram are the same in performance (signal voltage across C3).
Attachments
Actually, I have VituixCAD and Xsim. I use them often. However, the objective of this post is to find the empirical formula for the variables in the question, L2 and C3. Using simulators is within my ability but derivation of the formula involving advanced mathematics is beyond my ability.Assuming you're not on OSX (in which case an emulator will be needed), how about simulating it for yourself with one of the several free software programmes out there e.g VituixCAD (as above) XSim, PCD, WinPCD? That way, you can try all this and many more things for yourself.
An example of what I was looking for is something about this.
I think it would be relatively useful for any DIYers who are going to build a 2.5 ways crossover, like me.
That's the general procedure outlined in post #8 above. Details:
https://gtuttle.net/electronics/topics/second_order_filters_intro.pdf
https://gtuttle.net/electronics/topics/second_order_filters_intro.pdf
I’m just a bit confused. If we substitute s = jw = j6.28f, the final result will be T(w) or impedance in term of frequency “f”, won’t it?That's the general procedure outlined in post #8 above.
If so, can we find the L2 and C3 formulae in terms of R and L3, without “f” variable in them?
First find the s domain transfer function T(s).
Since s = σ + jω, to get the steady state sine response T(ω) set σ = 0 and substitute s = jω, where ω = 2Pi x f
Then find the sine wave magnitude response: sqrt [ T(ω) x T(ω)* ] where T(ω)* is the complex conjugate of T(ω).
Then set the magnitude response equal to 1/sqrt2 and constrain ω = 2Pi x 80Hz. Also set R = 8R/2 per post #13.
Then you will have an equation in L2 and C3 . Choose one for a convenient value, and the other is determined.
The L3 value is arbitrary, but choose C2 = L3/R^2. Note the "R" in the magnitude response is actually the value R/2 per post #13.
- Home
- Loudspeakers
- Multi-Way
- Final impedance/resistance analysis