left click on the waveform name to get cursor 1
left click on the waveform name a second time to get cursor 2
see the slope entry in the box that it brings up
Update My Dynaco
Akitika Preamp and Power Amp Kits
left click on the waveform name a second time to get cursor 2
see the slope entry in the box that it brings up
Update My Dynaco
Akitika Preamp and Power Amp Kits
Attachments

left click on the waveform name to get cursor 1
left click on the waveform name a second time to get cursor 2
see the slope entry in the box that it brings up
And just to point out (because this is where knowledge is assumed) that LT is working to SI base units and their derivatives which means the headline figure of 96875.9 really means 96875.9 volts per second or 0.096875.9 volts/uS
left click on the waveform name to get cursor 1
left click on the waveform name a second time to get cursor 2
see the slope entry in the box that it brings up
Update My Dynaco
Akitika Preamp and Power Amp Kits
Hello
I've did as you suggest, but it's not work like your simulation.
Can you post your .asc file ?
I include an image of my simulation.
Thank
Bye
Gaetan
Attachments

You're very close.
You just need to click on the node title a second time to get the second cursor.
You just need to click on the node title a second time to get the second cursor.
Hello
I did click on the node title a second time to get the second cursor, but it did same than the first cursor and it did not show slew rate.
Thank
Bye
Gaetan
I did click on the node title a second time to get the second cursor, but it did same than the first cursor and it did not show slew rate.
Thank
Bye
Gaetan
when you click to get the second cursor, the two will be superimposed.
drag on the cursor(s) and they will separate.
drag on the cursor(s) and they will separate.
Hello
I just did as you suggest but still not show the slew rate.
Can you post your .asc file ?
Thank
Bye
Gaetan
I just did as you suggest but still not show the slew rate.
Can you post your .asc file ?
Thank
Bye
Gaetan
if you pm me, we could do a quick phone call or skype to help.
Hello
I live in mid-north forest in Quebec (Canada), so it's a low speed internet and no affordable long distance plan.
Thank
Bye
Gaetan
Hello
I did use your your .asc file and it seem that my LTspice software are configured differently than your LTspice software, so that's why my simulation are not working same as your simulation.
Thank
Bye
Gaetan
I did use your your .asc file and it seem that my LTspice software are configured differently than your LTspice software, so that's why my simulation are not working same as your simulation.
Thank
Bye
Gaetan
Hello
Here's images of my LTspice software are configuration, maby you can tell me what are different than your configuration ?
Thank
Bye
Gaetan
Here's images of my LTspice software are configuration, maby you can tell me what are different than your configuration ?
Thank
Bye
Gaetan
Attachments


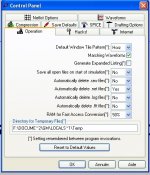
I can't see anything in the settings that would affect this.
Are you sure when you left click the green text Vn002 on top of the waveform viewer that you don't get a second superimposed trace. The 'Cursor 2' text in the small window called 'Draft 1' (bottom right of your diagram) should expand to show the details of the second cursor.
Here is a different circuit. This shows what you see for 1 click and for 2 clicks of the waveform.
One click.

And for two clicks.

Are you sure when you left click the green text Vn002 on top of the waveform viewer that you don't get a second superimposed trace. The 'Cursor 2' text in the small window called 'Draft 1' (bottom right of your diagram) should expand to show the details of the second cursor.
Here is a different circuit. This shows what you see for 1 click and for 2 clicks of the waveform.
One click.
And for two clicks.
Attachments
Hello
I found my errors, I did not select two cursors.
Looking in my Book-case, I taked the book Designing Audio Power Amplifiers, by Bob Cordell.
It take me a bit of time to read the LTspice chapter and find about slew rate.
In the book it said that the transient need to have a stop time of 80 µs. And we need to set the
input source for a 50-kHz square wave of 0.1 V pea, the initial voltage at –0.1 V, the pulse voltage at 0.1 V, the rise and fall times 10 ns, the pulse time at 10 µs and the period at 20 µs.
I have to run the simulation and probe Vout, and to right-click on the Vout label and select two cursors in the pop-up window. Put the cursors to be 1 µs apart on the straight slope, in the information box the slope number are the slew rate. I found my errors, I did not select the two cursors.
I'm french speaking, so I'm not sure what mean Put the cursors 1 µs apart on the straight slope ?
Thank
Bye
Gaetan
Last edited:

- Status
- Not open for further replies.
- Home
- Design & Build
- Software Tools
- How do we measure the slew rate of a simulated circuit with LTspice ?