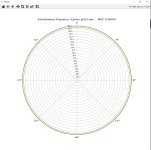
This thread is a spin off from the now closed "Turntable Speed Stability" thread. Scott Wurcer had posted a Python script that read a .wav file of a 3150Hz test LP tone and plotted 2 revs on a polar plot to display W&F. I've since taken the script and made a number of additions to it:
1. Make all of the parameters user selectable from the command line.
2. Added an optional 3rd plot for a reference line at a user selected frequency.
3. Added a direct W&F measurement (2-Sigma method) and display the results on the plot.
4. Created a simple Visual Basic app that allows the user to load the .wav file and set the parameters.
5. A "rotate" parameter to realign the output with previous plots to make comparisons easier.

I wasn't able to get the VB app to work with newer versions of Python because of the Anaconda prompt, but it works fine on v2.0 and older.
Below is a plot I made from a prototype direct drive turntable taken directly from the optical encoder attached to the platter. The Hz/Tick value is 1Hz where the normal resolution on Scott's version was 3Hz, so it is 3x more sensitive.
The modified .py file is attached (file extension is changed to .txt). Hats off to Scott Wurcer for the original script.
To run this from the command line, type: C:\>Python polarplotVB.py [wavefile.wav] [filter freq] [Secs/Rev] [Hz/Tick] [center freq] [rotate deg]
For the above example: C:\>Python polarplotVB.py "LSI75 24-Oct-23.wav" 45 1.8 1.0 3125 0 {extra spaces added for clarity}
The quotes are needed around the .wav file because it has a space in the name; the quotes prevent the command prompt from interpreting the name as 2 separate parameters.

1. Make all of the parameters user selectable from the command line.
2. Added an optional 3rd plot for a reference line at a user selected frequency.
3. Added a direct W&F measurement (2-Sigma method) and display the results on the plot.
4. Created a simple Visual Basic app that allows the user to load the .wav file and set the parameters.
5. A "rotate" parameter to realign the output with previous plots to make comparisons easier.
I wasn't able to get the VB app to work with newer versions of Python because of the Anaconda prompt, but it works fine on v2.0 and older.
Below is a plot I made from a prototype direct drive turntable taken directly from the optical encoder attached to the platter. The Hz/Tick value is 1Hz where the normal resolution on Scott's version was 3Hz, so it is 3x more sensitive.
The modified .py file is attached (file extension is changed to .txt). Hats off to Scott Wurcer for the original script.
To run this from the command line, type: C:\>Python polarplotVB.py [wavefile.wav] [filter freq] [Secs/Rev] [Hz/Tick] [center freq] [rotate deg]
For the above example: C:\>Python polarplotVB.py "LSI75 24-Oct-23.wav" 45 1.8 1.0 3125 0 {extra spaces added for clarity}
The quotes are needed around the .wav file because it has a space in the name; the quotes prevent the command prompt from interpreting the name as 2 separate parameters.
Attachments
Many thanks Bill, this will be very useful for those of us who want to know how well our turntables ( bought and DIY) perform
Another version in use...
https://www.audiosciencereview.com/...able-wow-and-flutter-polar-plot-script.48727/
https://www.audiosciencereview.com/...able-wow-and-flutter-polar-plot-script.48727/
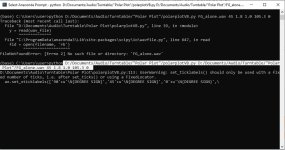
Ok Got it working I downloaded and installed Anaconda. And finally worked out you need to add the full path for the .py script then the .wav file

At 3kHz the settling of the filter doesn’t cause an issue. At 100Hz it does. You’ll see a similar issue with MI at the beginning and end of the signal if you look at the FM demod in the time domain.
You are typing Windows command shell syntax to a Python REPL!! To just run a python file don't enter the python REPL, just run from the commandline, as in
"python polarplotVB.py FG_alone.wav".
Just typing "python" enters the REPL, from which you can type python code directly.
- Home
- Source & Line
- Analogue Source
- Polar Plot Python Script


