I got interested in obtaining better-than-1% matching of metal film resistors, especially "uncommon" values among the E96 series of standard resistors, that are not offered / are not stocked in the (much more expensive) 0.1% tolerance grade.
I decided I was willing to buy six resistors and pick the best matching pair among them, then discard the other four. So I put together a little Monte Carlo simulation to see just how good or just how bad the results might be. Assumptions built into the simulation
I fired up the computer and performed one hundred thousand trials. Each trial consists of: (a) Generate six random resistor values, uniformly distributed between 99 and 101 ohms; (b) for each possible resistor pair, calculate the mismatch; (c) report the best [lowest!] mismatch of all possible pairs. Results, in ascii .csv format so anyone can slurp the data into a spreadsheet, were:
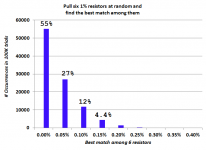
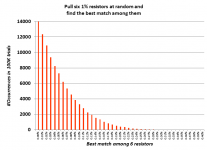
I made two histogram plots, one with very few bins and another with very many bins. They are shown here.
I have to say, I'm delighted by these results. About once per ten thousand trials, the best match is "terrible", namely 0.31 to 0.40%. On the other hand, there's a 55 percent chance that the best match is "fantastic", namely 0.05% or better. Woo hoo.


_
I decided I was willing to buy six resistors and pick the best matching pair among them, then discard the other four. So I put together a little Monte Carlo simulation to see just how good or just how bad the results might be. Assumptions built into the simulation
- Resistors are "100 ohm, 1% metal film" devices. Smallest possible resistance is 99.00 ohms, largest possible resistance is 101.00 ohms
- Resistances are uniformly distributed; all values between 99 and 101 ohms are equally likely
- Mismatch between two resistors is defined to be [(Rbigger - Rsmaller) / Rsmaller]
Code:
mismatch,count
0.00000,13990
0.00010,12335
0.00020,10917
0.00030,9358
0.00040,8251
0.00050,7289
0.00060,6197
0.00070,5345
0.00080,4558
0.00090,3854
0.00100,3301
0.00110,2781
0.00120,2263
0.00130,1926
0.00140,1558
0.00150,1359
0.00160,1047
0.00170,816
0.00180,659
0.00190,536
0.00200,420
0.00210,346
0.00220,253
0.00230,180
0.00240,136
0.00250,110
0.00260,78
0.00270,64
0.00280,36
0.00290,15
0.00300,10
0.00310,8
0.00320,1
0.00330,1
0.00340,1
0.00350,0
0.00360,1
0.00370,0
0.00380,0
0.00390,0
0.00400,0
I have to say, I'm delighted by these results. About once per ten thousand trials, the best match is "terrible", namely 0.31 to 0.40%. On the other hand, there's a 55 percent chance that the best match is "fantastic", namely 0.05% or better. Woo hoo.
_
Attachments
How random is your random number generator ")
RANDOM.ORG - True Random Number Service
You could better this with a quantum random number generator but that a cheaper system
RANDOM.ORG - True Random Number Service
You could better this with a quantum random number generator but that a cheaper system
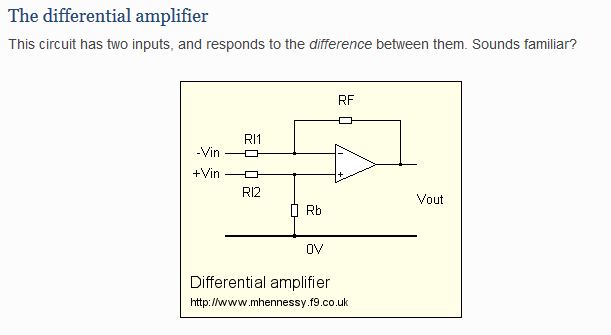
I don't think that will help a lot with a Ladder DAC circuit, where the resistors should IIRC be very exact, but I can see the use in differential op-amp set up where you want precise values on pair R11 and R12, and also on the pair Rf and Rb, for good common-mode rejection without being terribly interested in the precise gain.
Is this like the problem of 6 (or was it 30?) people at a Party or something. It's surprising the chances of two of them having the same Birthday.
Is this like the problem of 6 (or was it 30?) people at a Party or something. It's surprising the chances of two of them having the same Birthday.
They all drift - standard is 100 ppm, but if you pay a bit more you get 50 or 25 ppm.
Generally, resistors of the same value and from the same manufacturer drift in the same direction and by a similar amount.
(I worked in industrial instrumentation in a former life with low drift signal conditioning- we paid top $ for precision resistors).
Generally, resistors of the same value and from the same manufacturer drift in the same direction and by a similar amount.
(I worked in industrial instrumentation in a former life with low drift signal conditioning- we paid top $ for precision resistors).
Chances are that the calculation is still too pessimistic, if the resistors are normally distributed or at least have a distribution that rolls off gradually near the ends of the tolerance interval. It might be too optimistic if the best resistors are selected and sold as precision resistors.
Mark,
My experience is that resistors made together match better than random spreads would indicate. So I measured 30 Xicon 1% metal film 1/4 W 1,000 ohm resistors on my GR bridge. (Ignoring decimal points!)
The worst was 992.4 ohms or off by .76%
I suspect from the measure values, the manufacturer also tests the resistors and any that are within .1% of target value are selected and marked for .1%!
Results
9965
9974
9969
9953
9959
9944
9956
9952
9963
9961
9969
9979
9971
9992
9964
9953
9954
9966
9948
9968
9953
9970
9996
9961
9932
9961
9971
9953
9956
10005
The secret to measuring resistors precisely is to not touch the body of the resistor and change its' temperature.
Mean 9963.666 SD .16%
Last edited:
Bonsai: On the blue histogram, bin1 is the interval [0.00% - 0.05%) and 55% of all 6-resistor trials fell in that bin. That's why I wrote
Excel plots label the histogram bins with the interval-begin value, which I haven't discovered how to modify. So the bin [0.00% to 0.05%) ls labeled "0%" . I was hoping that typing it out in words, quoted above, would make it more clear.
Other non-Excel plotting software I have used, positions the labels below the interval edges (rather than the interval centers), making it a lot more clear that bin1 covers 0.00% to 0.05%. But I ain't gots that software no mo. Durn.
_
On the other hand, there's a 55 percent chance that the best match is "fantastic", namely 0.05% or better.
Excel plots label the histogram bins with the interval-begin value, which I haven't discovered how to modify. So the bin [0.00% to 0.05%) ls labeled "0%" . I was hoping that typing it out in words, quoted above, would make it more clear.
Other non-Excel plotting software I have used, positions the labels below the interval edges (rather than the interval centers), making it a lot more clear that bin1 covers 0.00% to 0.05%. But I ain't gots that software no mo. Durn.
_
Last edited:
It might be too optimistic if the best resistors are selected and sold as precision resistors.
No that would be good too. Remember we seek a matched pair, not a precisely-equal-to-nominal-value resistor. If you chop out and discard any region(s) of the distribution, the remaining zones of the distribution all get taller. And that increases the likelihood of a better match.
Take it to a ridiculous extreme: the manufacturer carefully tests and removes all resistors that are within 0.99% of the stated value. Leaving only two very thin zones behind: (99 ohms to 99.01 ohms) and also (100.99 to 101 ohms). When you pull six resistors from this screwball distribution you're guaranteed to get an excellent match. Even though neither resistor is especially close to the nominal 100 ohm value.
Pure uniform distribution is the worst case, and that's why I used it. Gaussian, truncated gaussian, triangular, and missing-zones-uniform distributions are all better at delivering matched pairs.
Bonsai: On the blue histogram, bin1 is the interval [0.00% - 0.05%) and 55% of all 6-resistor trials fell in that bin. That's why I wrote
Excel plots label the histogram bins with the interval-begin value, which I haven't discovered how to modify. So the bin [0.00% to 0.05%) ls labeled "0%" . I was hoping that typing it out in words, quoted above, would make it more clear.
Other non-Excel plotting software I have used, positions the labels below the interval edges (rather than the interval centers), making it a lot more clear that bin1 covers 0.00% to 0.05%. But I ain't gots that software no mo. Durn.
_
That’s fantastic. I usually get quite right tolerances and it’s pretty easy to select to 0.1% match but this confirms the spreads are indeed very tight. (Self also talks about this in one of his books).
I just tried out this online calculator for Birthday matches with a slight modification. We assume the 6 resistors can fall into 20 defined areas of accuracy....
Understanding the Birthday Paradox – BetterExplained
Try out the birthday paradox
Items: 20 People: 6
Number of pairs 15 = (6 * 5)/2
Chance of a unique pair 95.0000% = 19/20
Chance of 15 unique pairs 46.33% = (95.0000%)^15
Chance of some match 53.67% = 1 - 46.33%
Actual Match % 100.00% = (1/1)
I have no idea what I am doing here, TBH. But interesting, eh? Must be the same problem.
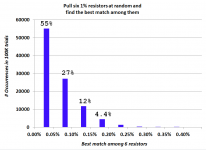
It occurred to me that if I can't get Excel to slide the histogram x-axis labels so they align with the bin BOUNDARIES rather than the bin centers . . . . . .
I sure can get MS Paint to do it!
So here's the few-bars histogram again, with the labels scooted to the left a wee ooch. I hope this makes it more clear that the first bin / first bar on the histogram, represents resistor pairs whose mismatch is >= 0.00% and < 0.05%.
55% of all trials found a resistor pair whose mismatch is less than 0.05%.

_
I sure can get MS Paint to do it!
So here's the few-bars histogram again, with the labels scooted to the left a wee ooch. I hope this makes it more clear that the first bin / first bar on the histogram, represents resistor pairs whose mismatch is >= 0.00% and < 0.05%.
55% of all trials found a resistor pair whose mismatch is less than 0.05%.
_
Attachments
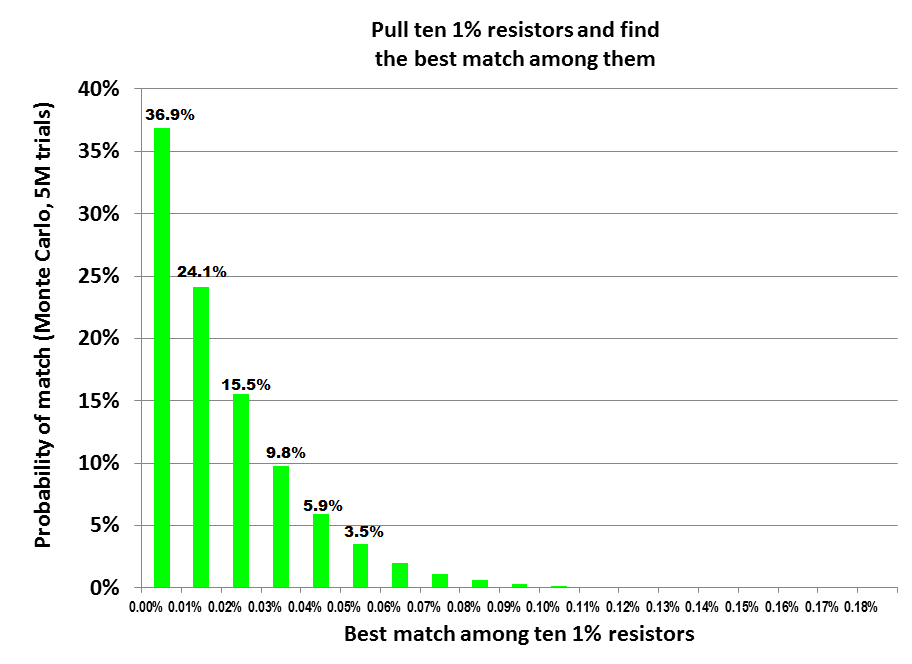
Curiosity got the better of me, so I asked the simulator to find the best match among TEN 1% resistors (rather than six, as before). I also increased the number of Monte Carlo trials by a factor of 50x; it's now 5 million bags of ten random resistors per bag.
Matching got better, as expected. Here's the raw data
_
Matching got better, as expected. Here's the raw data
Code:
mismatch,prob,cumulative
0,0.368985,0.368985
0.0001,0.241144,0.610129
0.0002,0.155027,0.765156
0.0003,0.097568,0.862724
0.0004,0.059226,0.92195
0.0005,0.03512,0.95707
0.0006,0.020204,0.977274
0.0007,0.011172,0.988446
0.0008,0.005968,0.994414
0.0009,0.003031,0.997445
0.001,0.001458,0.998903
0.0011,0.000658,0.999561
0.0012,0.000281,0.999842
0.0013,0.000108,0.99995
0.0014,0.000037,0.999987
0.0015,0.000012,0.999999
0.0016,0.000002,1
0.0017,0.000001,1
0.0018,0,1
_
Attachments

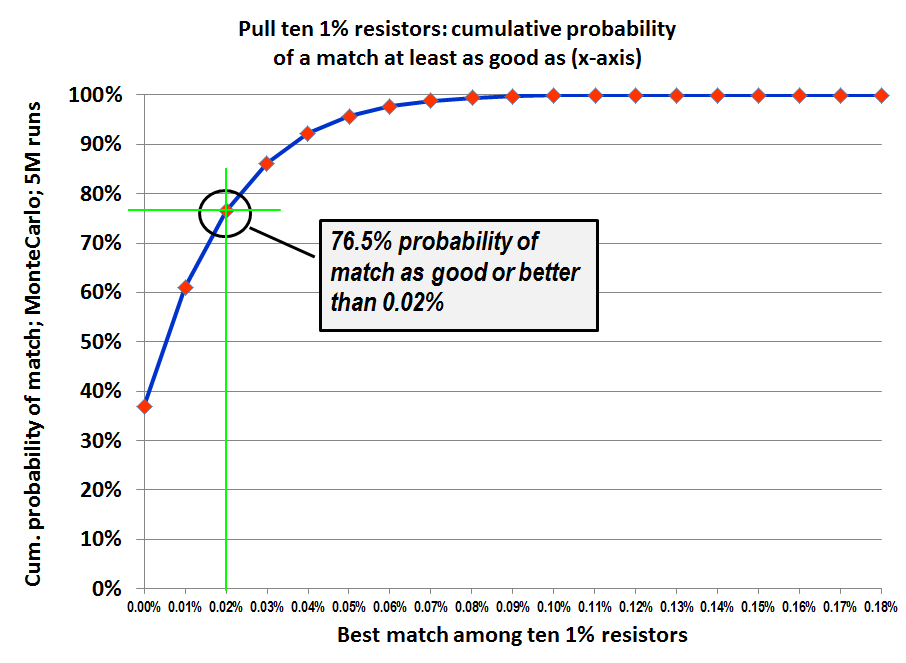
This diagram I like:

36.9 + 24.1 + 15.5 = 76.5% likelihood to get within 0.03% match.
I tried this with the Birthday method. 32 slots and 10 resistors gets near this likelihood of a match.
Understanding the Birthday Paradox – BetterExplained
Try out the birthday paradox
Items 32 : People 10: reset
Number of pairs 45 = (10 * 9)/2
Chance of a unique pair 96.8750% = 31/32
Chance of 45 unique pairs 23.96% = (96.8750%)^45
Chance of some match 76.04% = 1 - 23.96%
Actual Match % 100.00% = (1/1)
But my match is 32 Items between -1% and +1%. Which is 1/16 or 0.0625% match.
Two things are different.
If two resistors share a 0.0625% tolerance band, there is a likelihood they will be much closer than 0.0625% in fact. I don't know what the statistics of that are, but likely not far off being twice as good. So maybe close to a 0.03% match too.
Second, the Birthday Method ignores something in the adjacent band which might be quite close to something in the one we've just found. It can't add more than a 1 in 4 chance though with 9 left out of 32, I reckon. So it's a small correction I think.
That's where I have got to so far.
Last edited:
A little bit of math:
1. Pull a resistor out of 6 (so 5 left). Since the probability in the [a, b] interval is uniform, any value is possible there. Let's call this value S1 (sample 1).
2. Around S1, consider an interval [a', b'] defined by the desired matching tolerance.
3. Pull another resistor with value S2 (4 left). S2 can also be anywhere in [a, b] with equal probability; the probability to fall in [a', b'] is P2=(b'-a')/(b-a).
4. The probability for S2 to be OUTSIDE of [a', b'] is obviously 1-P2=1-[(b'-a')/(b-a)]
5. Keep pulling resistors. The probability that 5 resistor will all fall OUTSIDE [a', b'] is then P={1-[(b'-a')/(b-a)]}^5 (or in general ^(N-1) where N is the number of resistors to start with.
6. Now the probability to have AT LEAST one resistor in [a', b'] is 1-{1-[(b'-a')/(b-a)]}^5
7. We are still not done yet. Since we constraint the problem to matching the FIRST resistor extracted, and considering the problem is symmetrical for all resistors (e.g. S2 may match with S4) we need to add all these probabilities. There are C(5,2) possible matching (since S1 matching S2 is the same as S2 matching S1) therefore we have to divide the result in step 6 by C(N-1,2)
Plug in some numbers
a=99
b=101
b'-a'=0.1 (meaning 0.05%)
P2=0.05
1-P2=0.95
P=0.095^5=0.773
0.773/C(5,2)=0.0773
1-P=0.927
So the probability to find 2 resistors matched to 0.05% in 6 resistors of 1% is 93%. Of course, this result assumed an uniform distribution of the six resistor values, which may not be true. Practically, any distribution beyond uniform increases the success probability, so 93% is kind of worst case. Not sure why your simulation rendered more pessimistic results.
If you use a quantum source qubit as a Bernoulli variable would reduce the iterations.
All you need to use is a piece of paper, a pen, and 15 minutes of your life. Cheaper and faster
.- Home
- Design & Build
- Parts
- Resistor matching error starting with six 1% resistors