I'm probably asking something stupid, but I'm struggling to calculate by hand the amplifier output power that matches the one calculated by LTSpice. Here are the numbers:
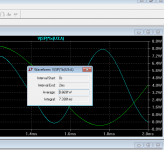
outputpower: RMS(v(out4)*i(r7))=31.2566 FROM 0 TO 0.02
outputvoltage: RMS(v(out4))=14.2886 FROM 0 TO 0.02
outputcurrent: RMS(i(r7))=1.78608 FROM 0 TO 0.02
outputpowerv2: RMS(v(out4)*v(out4)/8)=31.2566 FROM 0 TO 0.02
I can match the RMS for the voltage and current. But how do they get 31W from that (R7 = 8ohms)?
RMS(v(out4) = 14.33V
RMS(Iout) = 1.79A
P(RMS) = 14.33*1.79 = 25.6W
or
P(RMS) = (14.73^2)/8 = 25.6W.
How they get to 31?
Thank you!
rms
I'm not sure what you are doing??? I just plot V(load)*I(load) and take half the peak value, assuming a sine wave is the standard. Taking values off the plot is plenty accurate enough. Sure, some other wave shape could carry more power, but actual audio has a much lower power/peak ratio. Expressed in dB's, 20% is ~nothing.
PS: power may be less than VI if the phase is not the same.
Attachments

Last edited:
in Spice directive:
.param period=1m, ncycles=100
.MEAS TRAN power_Output AVG I(RLoad)*V(Out) TRIG time=20*period TARG time=40*period
.param period=1m, ncycles=100
.MEAS TRAN power_Output AVG I(RLoad)*V(Out) TRIG time=20*period TARG time=40*period

I'm not sure what you are doing??? I just plot V(load)*I(load) and take half the peak value, assuming a sine wave is the standard. Taking values off the plot is plenty accurate enough. Sure, some other wave shape could carry more power, but actual audio has a much lower power/peak ratio. Expressed in dB's, 20% is ~nothing.
PS: power may be less than VI if the phase is not the same.
RMS power does not exist.
U(rms) x I(rms) = P(average), not P(rms)
OK, I understand that. In my case P(avg) is 25W as I expected.
Thanks!
Thank you! This one does exactly what I wanted:in Spice directive:
.param period=1m, ncycles=100
.MEAS TRAN power_Output AVG I(RLoad)*V(Out) TRIG time=20*period TARG time=40*period
....
power_output: AVG(i(r7)*v(out4))=25.5217 FROM 0.02 TO 0.04
....
I wonder if I've been doing it wrong.
1) Find the maximum peak voltage out at the distortion level that's tolerable to you (say, 1.0% THD).
2) Take that Vpeak max and multiply by 0.707 = max Vrms out
3) Take that result and square it
4) Take the square of the max Vrms out and divide by the load resistance
That should be your max RMS power out... Right?
Stated Vout and Iout reach 25W.
Their ratio matches 8 ohm load.
So those values are consistent at least.
Not sure where 31W comes from,probably an interpretation error.
MIGHT be the power drawn from the PSU, but only you have the full picture, please check that out.
Might also be the power it WOULD put out IF the supply did not drop.
As you see, nothing out of this World but we lack a lot of data.
Just plot the power waveform V(out)*I(Rload) and take half the peak. This also deals with any phase issues.
Thank you everyone for your input. I think is quite clear now, what I was doing by hand was right, and the script I was using is wrong:
RMS(v(OUT)*i(RL)) returns 31.2566 ********wrong, and I have no idea how LTSpice is getting 31
now I use
AVG(v(OUT)*i(RL)) returns 25.5217 ********Correct value that matches real measurements.
is a typical amp output, 1Khz sinusoidal signal and an 8 ohm resistive load.
RMS(v(OUT)*i(RL)) returns 31.2566 ********wrong, and I have no idea how LTSpice is getting 31
now I use
AVG(v(OUT)*i(RL)) returns 25.5217 ********Correct value that matches real measurements.
is a typical amp output, 1Khz sinusoidal signal and an 8 ohm resistive load.
The RMS function in LTSpice is a standatd function which solves the attached integral.Thank you everyone for your input. I think is quite clear now, what I was doing by hand was right, and the script I was using is wrong:
RMS(v(OUT)*i(RL)) returns 31.2566 ********wrong, and I have no idea how LTSpice is getting 31
now I use
AVG(v(OUT)*i(RL)) returns 25.5217 ********Correct value that matches real measurements.
is a typical amp output, 1Khz sinusoidal signal and an 8 ohm resistive load.
This works well for a voltage or a current over time.
In your RMS(v(OUT)*i(RL)) script LTSpice you force LTSpice to apply the same integral to the product of voltage times current over time and this is undefined or just meaningless.
Had you simply multiplied the RMSs of voltage and current: RMS(v)*RMS(i) the result would have been the correct one.
By the way there is an alternate way to get the average power:
- run a transient analysis
- hover the mouse pointer over the load (can be anything, Resistor, Transistor, Tube ... actually any power dissipating element) while holding down AltGr
- now left click when you see the thermometer icon pop up above this element
- this displays a curve of the power dissipation over time
- now while holding down AltGr again right click on the power formula on top of the display window which pops up a window with the correct average power
- the power formula can be simple in case of a resistor or quite complex in case of a pentode in which case it includes plate, screen and grid disspation.
Attachments

For those of us on simpler keyboards: usually Right-ALT. (The ALT key on the right of the spacebar.)while holding down AltGr
https://en.wikipedia.org/wiki/AltGr_key
Where is this script being input, please?Thank you everyone for your input. I think is quite clear now, what I was doing by hand was right, and the script I was using is wrong:
RMS(v(OUT)*i(RL)) returns 31.2566 ********wrong, and I have no idea how LTSpice is getting 31
now I use
AVG(v(OUT)*i(RL)) returns 25.5217 ********Correct value that matches real measurements.
is a typical amp output, 1Khz sinusoidal signal and an 8 ohm resistive load.
- Home
- Amplifiers
- Tubes / Valves
- RMS Output Power calculation in LTSpice