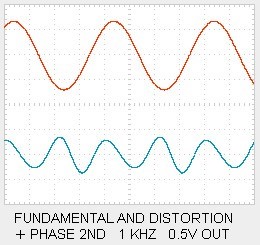
If I want to see the waveform of my fundamental frequency and the distortion, do I need a spectrum analyzer? Getting an oscilloscope that can do FFTs will show me the magnitude and harmonic characteristics of distortion, but I assume it can't show me the waveform like above?
To see a waveform like you've shown you'd need a notch filter and post-amplifier. Oscilloscopes that do FFTs tend to have limited dynamic range (the scope's ADC is normally only 8bits though there are exceptions) which probably isn't enough for audio work.
The HP 330 Series THD Analyzers output the distorted signal that can be viewed on a scope. HK also had a similar THD in kit form, some shew up on the used market.
Hmm, perhaps I’m thinking about this wrong. I assumed an oscilloscope with FFT function would show me fundamental, plus 2nd, 3rd, 4th, etc distortion harmonics, and that I would need an analyzer to see the distortion waveform.
Let me ask a better question: If I want to see signal/distortion vs noise ala FFT form *and* the waveform of the distortion, what box do I need?
Let me ask a better question: If I want to see signal/distortion vs noise ala FFT form *and* the waveform of the distortion, what box do I need?
A spectrum analyser graphically presents the magnitude and phase of all individual harmonic distortion components, plus any noise. The simplest 'box' for that is a soundcard and modern software. To me, that spectrum display of the harmonics means a lot more than a time domain plot of the distortion residuals. Note that the plot in your first post appears to show a 2nd harmonic mixed with some higher order harmonics, but you can't really tell much except that the 2nd seems substantial. So I guess the query is why do you seem to think you just need to 'see' the harmonic residual?
Once the vector H1, H2,... Hx values are measured, it's simple to draw a chart with them. Or taking the original waveform and subtracting the fundamental only, leaving the noise + distortions. Or subtracting both the fundamental and all Hx, leaving only the noise and non-harmonic spurious to zoom into.
Three Different Ways to Measure Distortion
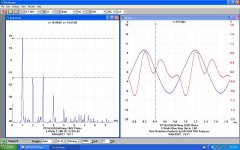
A PicoScope 12 bit FFT displays the harmonics directly. An HP334A THD Analyzer notches out the fundamental & a trace of the harmonics can be seen in red.
The PicoScope measures the Intermod Products (SMPTE) of 80Hz & 5KHz in Ratio 4:1 as Sidebands on the 5KHz signal.
The IMD is measured by the 3:4 frequency method devised by Graeme Cohen. This method separates the Harmonics from the Intermod Products. Cohen's paper describing the 3:4 method is attached for the curious.
All on the same PP 6EA7/6EM7 experimental amplifier. A regulated lab supply provides a B+ of 260V. The OPT is a Hammond 125E Universal. There are no boutique parts used at all
Attachments


A PicoScope 12 bit FFT displays the harmonics directly. An HP334A THD Analyzer notches out the fundamental & a trace of the harmonics can be seen in red.
The PicoScope measures the Intermod Products (SMPTE) of 80Hz & 5KHz in Ratio 4:1 as Sidebands on the 5KHz signal.
The IMD is measured by the 3:4 frequency method devised by Graeme Cohen. This method separates the Harmonics from the Intermod Products. Cohen's paper describing the 3:4 method is attached for the curious.
All on the same PP 6EA7/6EM7 experimental amplifier. A regulated lab supply provides a B+ of 260V. The OPT is a Hammond 125E Universal. There are no boutique parts used at all
A PicoScope 12 bit FFT displays the harmonics directly.
So you mean, you connect the probe from the PicoScope directly to the output of the amplifier?
An HP334A THD Analyzer notches out the fundamental & a trace of the harmonics can be seen in red.
Here, you are connecting the PicoScope to the output of the HP334A, which produces the red trace?
Which PicoScope do you have? I'm looking at the bandwidth of the different models. When they say "10 to 100 MHz" do the mean "10 Hz to 100 MHz"?
EDIT: Any of the HP33X series would work? I could get a 331 or 332 pretty easily locally.
Last edited:
Unless you are designing or modifying circuits, you do not need this at all.
First build up experience, learn to swim before taking up show diving.
Keep an eye out for equipment being sold at business closures and estate sales, a lot is being sold at near scrap value.
First build up experience, learn to swim before taking up show diving.
Keep an eye out for equipment being sold at business closures and estate sales, a lot is being sold at near scrap value.
Unless you are designing or modifying circuits, you do not need this at all.
So?
Superfluous to DIY audio...
But if you like boy toys, nice.
I have seen workshops full of equipment, assorted hand tools, in Popular Mechanics magazine in the 1970s...
Most were on display in basements, to be used by one person only.
Like a display in a tools store.
For some, boy toys, and for others who like to use the exact tools, essential.
So basically it is your decision what is essential, and how useful it is going to be.
I want to be able to view the distortion level and harmonics. If there is an easier way to do that, I'm all ears. Whether or not I need to is irrelevant, I want to be able to see how the stuff I work on is performing, since that is one way amplifiers are measured/observed in reviews.

You are near Silicon Valley, find out equipment on sale.
There is somebody called Apex or similar, military surplus.
You might some unusual equipment on sale, they are also on California.
That is part of the enjoyment of working, having good equipment.
And the stories of where you found it, and how much of a bargain it was...
There is somebody called Apex or similar, military surplus.
You might some unusual equipment on sale, they are also on California.
That is part of the enjoyment of working, having good equipment.
And the stories of where you found it, and how much of a bargain it was...
Last edited:
Apex Jr. is in Los Angeles. I've bought some wire from him. Good idea to reach out to see if he has anything useful.
> having good equipment.
> And the stories of where you found it, and how much of a bargain it was
Aye, that's half the fun. My local area Craigslist is really good, between Sacramento and San Francisco. Right now there are over 20 oscilloscopes, a handful of spectrum analyzers, logic analyzers, power supplies, bench meters, and way more that I haven't even subbed across yet. I have a little analog scope I got to mess around with for $50. Just a matter of finding the stuff.
Which PicoScope do you have? I'm looking at the bandwidth of the different models. When they say "10 to 100 MHz" do the mean "10 Hz to 100 MHz"?
They mean that they have models with bandwidth from 10MHz (lowest cost) to 100MHz (highest cost).
They all work basically from DC upwards to the bandwidth.
Jan
Spectrum analysis shows the frequency domain, not the time domain, so no.If I want to see the waveform of my fundamental frequency and the distortion, do I need a spectrum analyzer? Getting an oscilloscope that can do FFTs will show me the magnitude and harmonic characteristics of distortion, but I assume it can't show me the waveform like above?
And standard oscilloscopes are 8 bit precision, not enough for audio distortion measurements, for which 14 or more bits is usually needed.
The easiest approach I think is using a sound card and software to do the analysis, as its pretty straightforward to do whatever analysis you want in software - for distortion measurement you just have to determine the best-fit frequency and amplitude match to the signal and subtract it off. The residual contains harmonics and noise, and these can be separated by FFT.
One way I've done this is simply to record the waveform from soundcard to WAV file and written some Python scripts using scipy.signal library for any analysis I want, for instance my distortion analysis script produces this sort of output, showing the best-fit sinusoid, residual, and spectrum including detected harmonics and noise level:

This is the distortion from an X7R ceramic capacitor on a 1kHz tone, for instance, so lots of odd harmonics.
The way it measures the harmonics is by correlation with a model waveform, giving the ability to see well below the FFT noise floor. The FFT was only used for drawing the green curve, not for measurement.
There are no doubt pre-package software out there that can do similar, but I've not researched this.
Last edited:
Nifty! Something PC based does seem to be the best solution. How did you feed the signal from the amplifier to your sound card? Did you build an attenuator?
SoaDMTGguy, there are lots of threads on this forum with that query, along with the general topic of using a soundcard to make audio measurements - I suggest you take your time and digest that large body of related information.
Simple and not too much money, and provides enough distortion information for most hobbyists:
Howto - Distortion Measurements with REW
Howto - Distortion Measurements with REW
- Home
- Design & Build
- Equipment & Tools
- Spectrum analyzer vs. FFT capability