I have a decent soundcard (focusrite scarlet) and with REW was doing some measurements on an interstage transformer and seeing more distortion in the 60Hz-1Khz range than I expected. So as a control I popped in a Lundahl LL1676 line input transformer and still saw some really high harmonic distortion numbers. In this case it's operating as a 1:0.5+0.5, balanced in and balanced CT out, using 1K ohm source resistors on each leg to simulate some tube Rp. Most notably this was only at about 1Vrms and no DC current, so should be nowhere near any kind of core saturation.
I'm perfectly expecting to see rising distortion at low frequency and rising power. But I really didn't expect, for instance 0.1% 3rd order harmonic at 300hz with just 1Vrms in what's supposed to be a fairly well regarded line input transformer and phase splitter. I did some more testing and it's a little suspicious that a large high power bifilar interstage, a lundahl amorphous core line input, and an off the shelf pro audio balanced isolator box all seem to have similar total distortion levels (around 0.5% in the 20-30Hz range, gradually dropping into the 1-2Khz range) at a low signal level of 1V rms. They do all have very different distortion profiles in terms of how much of each order and how they roll off though.
Has anyone else done this kind of distortion vs frequency sweep on transformers? The very few transformers that show a THD vs frequency graph, like the Jensen input transformers seem to show vastly less harmonic distortion in these areas and power levels, like it should be closer to 0.001% than 0.1% in the 100's of Hz range. Does the lundahl just have 100 times worse distortion than a typical Jensen, or is there something else going on that I'm missing.
Can you do an FFT at 100Hz, 1kHz and 10kHz which should be quite revealing and is easier to interpret. Yes, I have found that most transformers generate a broad distortion spectrum and level dependent.
Measurements on a Pikatron line xformer were in the same ballpark -
not surprising!
not surprising!
Attachments


I'll collect the individual frequency FFT's this weekend when I have some time. That was one thing I wondered if the frequency 'sweep' that it does wasn't indicative because of how it starts at effectively 0Hz maybe it was doing something weird to the transformer initially. But I at least confirmed just doing a simple 100Hz 1Vrms tone continually does show the indicated harmonics at the given levels, it's not just an artifact of the sweep function. A loopback test at the same frequency and voltage gives all the harmonics down in the noise floor. Examining the raw capture data shows no signs of clipping either.
Schematic-wise I'll try to draw something up too if more are curious. It's just the Focusrite scarlet balanced output, +/- each through separate 1K resistors, feeding the two "2" windings in parallel, and the secondary is the 1+1 windings, to give a 2:1+1 overall. (This is the commonly recommended input configuration for the 1676 as a push-pull amp input.) The secondaries are terminated with 47K resistors each side, center tap grounded, and then straight back into the +/- of the sound card input. I don't have any info on the Scarlet's output or input, I assume typical opamp stuff.
Schematic-wise I'll try to draw something up too if more are curious. It's just the Focusrite scarlet balanced output, +/- each through separate 1K resistors, feeding the two "2" windings in parallel, and the secondary is the 1+1 windings, to give a 2:1+1 overall. (This is the commonly recommended input configuration for the 1676 as a push-pull amp input.) The secondaries are terminated with 47K resistors each side, center tap grounded, and then straight back into the +/- of the sound card input. I don't have any info on the Scarlet's output or input, I assume typical opamp stuff.
I've measured these extensively using an APx515 and do get numbers a a bit lower than you do. My source impedance is 600 ohms and connected in 1:2, with both primaries and both secondaries in series for improved level handling. Here are measurements at 2.8VRMS on the primary. I think I had a 200k termination.

Each trace corresponds to each DC bias, with 1mV increments. Past 3mV DC, distortion increases (at 2.8VRMS) as the core begins to saturate. This is not uncommon for very high permeability cores like the Lundahl amorphous inputs.
A good way of telling that saturation is occuring is that even order distortion increases while odd order remains fairly constant. I see you're measuring significant second order distortion, so I wonder if your sound card might not have very low levels of DC. The input impedance of your ADC may also be low; I got funny results when attempting the measurements you performed using my MOTU M4 sound card.
Even order with increasing DC bias

Odd order with increasing bias

With all primaries in series, they can be demagnetized with about 40VRMS (!) of DC-free 20Hz signal. You need to gradually ramp the signal up from 0V to 40VRMS, then back down. I use a Talema 120V:18V power transformer wired in reverse to generate the high voltage without DC. 🙂 Some more details in section 4.2 of Jensen's PDF.
I have found that Lundahl's amorphous IPTs do measure slightly higher distortion than equivalent sized Jensens or Cinemags. The Cinemags have much, much higher DCR, so I suspect they accomplish lower distortion by putting more turns of thinner wire on a lower perm core. I prefer the Lundahls. 🤷
Good luck!
Each trace corresponds to each DC bias, with 1mV increments. Past 3mV DC, distortion increases (at 2.8VRMS) as the core begins to saturate. This is not uncommon for very high permeability cores like the Lundahl amorphous inputs.
A good way of telling that saturation is occuring is that even order distortion increases while odd order remains fairly constant. I see you're measuring significant second order distortion, so I wonder if your sound card might not have very low levels of DC. The input impedance of your ADC may also be low; I got funny results when attempting the measurements you performed using my MOTU M4 sound card.
Even order with increasing DC bias
Odd order with increasing bias
With all primaries in series, they can be demagnetized with about 40VRMS (!) of DC-free 20Hz signal. You need to gradually ramp the signal up from 0V to 40VRMS, then back down. I use a Talema 120V:18V power transformer wired in reverse to generate the high voltage without DC. 🙂 Some more details in section 4.2 of Jensen's PDF.
I have found that Lundahl's amorphous IPTs do measure slightly higher distortion than equivalent sized Jensens or Cinemags. The Cinemags have much, much higher DCR, so I suspect they accomplish lower distortion by putting more turns of thinner wire on a lower perm core. I prefer the Lundahls. 🤷
Good luck!
I'm not familiar with the transformers you are testing, but check what the intended source impedance is, this might or might not hurt. I have a lot of transforme coupled tube gear and I have noted amplifier spectra is significantly worse through input transformers without.
I use Lundahl amorphous cores LL1948 and LL1544 and find they are very sensitive to DC. (A few mV as noted above)
Driving impedance was 600R or less, secondary open (>100k)Can you draw the EXACT circuit of your test rig?
Include what is driving the tranformer (and their schematics if available) and what is the load.
Yes, these very hi permeable cores are quite sensitive against unbalance.I use Lundahl amorphous cores LL1948 and LL1544 and find they are very sensitive to DC. (A few mV as noted above)
Measure the distortion of the voltage before and after the 1k resistor(s) that feed the transformer. There should be no distortion before the resistors. If the distortion appears after the resistors, then it could be a bad wire connection to the transformer. It doesn't make much sense for the core itself to generate this kind of distortion.
Consider whether you may have a fake transformer, and test some similar transformers to see if they give a similar result.
Consider whether you may have a fake transformer, and test some similar transformers to see if they give a similar result.
If you drive the transformer from a very low (ideally zero ohms) impedance source, the distortion should disappear.
This is the basis for the resistance-compensation used by AP which is also documented on the Lundahl site.
If this works, you know the xformer is not the culprit. Impedance in series with the primary normally increases distortion.
https://www.lundahltransformers.com/wp-content/uploads/datasheets/feedbck.pdf
Jan
Last edited by a moderator:
I can attest to the Jensen bifilar JT-11DM attaining 0.001% over frequency range.
The Monolith IT-1 in circuit with SN7 driving it better than 0.01%.
No numbers to claim on the Cinemag CMOL2x600 or the Tribute IT, but vanishingly low as I recall.
I would agree on some earlier posts that you could have core saturation. The Lundahls are not my favorite, having replaced them nearly everywhere in my system, but they should be able to do better than what you are reading.
Last edited:
I may be out of my depth, but while the odd harmonics could be due to core saturation in combination with the 1k resistors, the even harmonics indicate a problem to me.
You need a negative impedance to compensate for the winding's own resistance - see the attached patent by Bruce Hofer.drive the transformer from a very low (ideally zero ohms)
Attachments
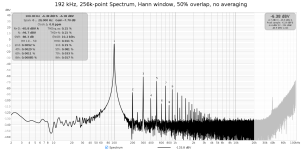
So I verified the Scarlett 2i2 has no DC output (less than 2 microvolts), and the output impedance of the balanced out is about 50 ohms per leg, so 100 ohms total.
As many of you suspected, eliminating the extra simulated 1K Rp source impedance dramatically lowers the distortion, though still a bit higher than I would expect I guess. The even order cancellation seems stronger, leaving mainly the odd orders smoothly decreasing. THD is still around 0.1% in the 20-60Hz range which seems too high for 1V RMS still, but I'm not sure where else to look there.
I need to take some measurements with the actual tubes & transformers together to see how the overall distortion profile looks, I suppose that's next.
Attachments


Interestingly, one of the reasons I bothered getting everything setup to measure some transformers was that I got Edcor to wind me a 1CT:1CT bifilar interstage, just to see what's possible on a budget as opposed to trying to import Monolith IT's. With the plan to drive them via possibly 6W6s, 5687's, or ECC99's depending on what I end up building. (Maybe PP 2A3, 300B, triode KT-77s. Or perhaps even 5687->6W6 if I end up not needing much power.)I can attest to the Jensen bifilar JT-11DM attaining 0.001% over frequency range.
The Monolith IT-1 in circuit with SN7 driving it better than 0.01%.
No numbers to claim on the Cinemag CMOL2x600 or the Tribute IT, but vanishingly low as I recall.
I would agree on some earlier posts that you could have core saturation. The Lundahls are not my favorite, having replaced them nearly everywhere in my system, but they should be able to do better than what you are reading.
They measure extremely well at high frequencies (don't open up until 400khz+), as expected. Measure pretty well with the 100 ohm source impedance as well, but with 1K source per leg (simulating 6W6's) is what kicked all this off and I started down this rabbit hole. If you're curious (Obviously it's possible I haven't chased all the issues out of my measurements, so don't take this as the final word on the performance):
Attachments


Last edited:
Lundahl has a nice one page app note showing positive feedback being utilized to zero out transformer primary winding resistance.You need a negative impedance to compensate for the winding's own resistance - see the attached patent by Bruce Hofer.
https://www.lundahltransformers.com/wp-content/uploads/datasheets/feedbck.pdf
At LF, transformer THD (mostly 3rd) is directly dependent on Level, Impedance & Frequency. eg
1% THD 1V 20Hz 100R
will also give
2% 2V 20Hz 100R
1V 20Hz 200R
1V 10Hz 100R
0.5% 1V 40Hz 100R etc
It's the Flux level and holds over a large LF Frequency, Voltage, Impedance range for most (all?) core materials. This level/freq/impedance/THD is a much better & reliable measure of transformer LF performance than the (very variable) Inductance or Freq Response.
Your results are much worse than the 1676 specs.
But as others have stated, your high level of even harmonics is VERY suspicious. The core might have become badly magnetised.
Have you got access to an old Tape Demagnetiser / Eraser ?
Last edited:
- Home
- Amplifiers
- Tubes / Valves
- Surprising transformer harmonic distortion measurements