What I do here is use one modest linear +5v power supply which is shared by the clean side of I2SoverUSB and by PCM2DSD. They both have their own secondary voltage regulators and they are both going to be on the same ground anyway. An LM7805 or something like that would be good enough. That said, I would isolate and reclock after PCM2DSD using external clocking, so the shared power supply should have little or no effect on final SQ anyway.A question for those who have experimented with PSs. Which of the following is more likely to have a noticeable impact on the sound quality of this DAC; using a low noise power supply on the Reclock side of the i2soverUSB or on the PCM2DSD ? Replying “both” will not answer the question I’ve asked 😉. Any thoughts?
I suggest you also include a HQPlayer quasi-multibit modulator (e.g. AMSDM7 512+fs) as a reference to your listening evaluation as such modulator has been shown to work well with this dac.I have the free version of HQplayer but unfortunately it doesn’t work with Amazon , it’s no problem to download a file though and use HQplayer .
HQ Player has a choice of upsampling filters and of modulators. The sound you get is dependent on both factors. Just to specify one factor does not fully specify the resulting sound. Trying AMSDM7 512+fs with a variety of filters may give some idea of what is attributable to the modulator itself.
@ThorstenL : I have been taking a brief look on some of the 74 types you mentioned in #2984 and #2982 and one of the differences I notice is that the inductances of the pins of the various packages vary quite a lot. And here your 74ALVC164245 IC appears to have a comparatively very balanced pin inductance which I reckon would be a feasible quality in this FIRDAC context ... 
And then, regarding clock adjustment I noticed that you would prefer to use a 1/100 division probe or an active probe. Would you happen to have a suggestion for an active probe that is accessible price-wise and works with BNC connectors? Would something like this work:
https://www.ebay.de/itm/33524613908...Kw9yld7MB7JhuM7saSfITAQQ==|tkp:Bk9SR-DL47fkYw
And, to this end, would you say that a 200 MHz oscilloscope would be sufficient for such a measurement?
Also, since you appear to be well-versed in various IC packages maybe I can ask you for a bit of advice on this: I am for comparison considering a basic R2R DAC. Would you happen to have a suggestion for an IC version that would be suitable for such a DAC? I am considering the 74LCX series as it should have balanced P/N outputs ... Do you think that would be the best choice for an R2R DAC?
And then, just for clarification and FYI ... I feel like mentioning that we may have different tastes in music as I am mostly into classical music ...")
@MarcelvdG : This design keeps simmering in my mind and I hope I can ask you a couple of questions in relation to something you have said previously ...
1. In a previous post (I couldn't find exactly where) you mention that inter-IC die variations may be larger than intra-IC die variations. Would you happen to be able to say how large these variations typically are and on which parameters of the ICs?
I have recently measured Ron on a couple of 74NC7SZ374 and 74AUP1G374s and at least for static conditions their P & N resistances are exactly the same (within my fluke multimeter's resolution). However, since the measured ICs were bought as part of the same order I suppose that they likely would be part of the same production batch and thus might have more identical specs ... Even with physically separate logic ICs wouldn't intra-batch ICs have (much) more identical specs than ICs coming from different batches?
2. In #2812 you say that:
It made me wonder to what extent timing differences between the various gates may also produce intermodulation/distortion products that are of the same magnitude? ... I remember quoting a bit of TI forum information in #1922 stating that:
Would it make sense to e.g. assess how much the IMD magnitude of e.g. a 50 ps difference in gate timing would produce ...??
Please comment as it is feasible to you ... For one thing I admittedly have no idea if this entails meter-long formulas to calculate
Cheers & have a fine day,
Jesper
And then, regarding clock adjustment I noticed that you would prefer to use a 1/100 division probe or an active probe. Would you happen to have a suggestion for an active probe that is accessible price-wise and works with BNC connectors? Would something like this work:
https://www.ebay.de/itm/33524613908...Kw9yld7MB7JhuM7saSfITAQQ==|tkp:Bk9SR-DL47fkYw
And, to this end, would you say that a 200 MHz oscilloscope would be sufficient for such a measurement?
Also, since you appear to be well-versed in various IC packages maybe I can ask you for a bit of advice on this: I am for comparison considering a basic R2R DAC. Would you happen to have a suggestion for an IC version that would be suitable for such a DAC? I am considering the 74LCX series as it should have balanced P/N outputs ... Do you think that would be the best choice for an R2R DAC?
And then, just for clarification and FYI ... I feel like mentioning that we may have different tastes in music as I am mostly into classical music ...
@MarcelvdG : This design keeps simmering in my mind and I hope I can ask you a couple of questions in relation to something you have said previously ...
1. In a previous post (I couldn't find exactly where) you mention that inter-IC die variations may be larger than intra-IC die variations. Would you happen to be able to say how large these variations typically are and on which parameters of the ICs?
I have recently measured Ron on a couple of 74NC7SZ374 and 74AUP1G374s and at least for static conditions their P & N resistances are exactly the same (within my fluke multimeter's resolution). However, since the measured ICs were bought as part of the same order I suppose that they likely would be part of the same production batch and thus might have more identical specs ... Even with physically separate logic ICs wouldn't intra-batch ICs have (much) more identical specs than ICs coming from different batches?
2. In #2812 you say that:
The plot in post #2696 shows that a +/- 1 ppm change of the bit weight depending on the previous bit is enough to produce about the same intermodulation products in the audio band as the present DAC and filter do.
It made me wonder to what extent timing differences between the various gates may also produce intermodulation/distortion products that are of the same magnitude? ... I remember quoting a bit of TI forum information in #1922 stating that:
And according to a post in TI's EE forum they expect CMOS ICs inter-gate skew to be less than 250 ps although this is not guaranteed.
Would it make sense to e.g. assess how much the IMD magnitude of e.g. a 50 ps difference in gate timing would produce ...??
Please comment as it is feasible to you ... For one thing I admittedly have no idea if this entails meter-long formulas to calculate
Cheers & have a fine day,
Jesper
1. Basically on all parameters, but I have too little information to give a quantitative answer to your questions about matching on a chip and within the same batch.
The only data I have about matching on one chip of standard logic ICs are in this thread, which won't help much: https://www.diyaudio.com/community/...eap-fet-differential-pair.228957/post-3347847
You can get an impression of the differences between chips of different batches by looking at minimum, typical and maximum datasheet values for a given temperature and supply voltage. The values are generally conservative to keep the yield loss small, like +/- 4 sigma to +/- 6 sigma values of a normally distributed parameter.
It will be considerably better within one batch, but only the people doing production testing know how much better. Chips at the edge of a wafer usually differ more from their colleagues than those that are not near the edge.
It will be better yet on one chip, but I can't tell you by how much. It depends very much on the process and layout.
2. Suppose you play DSD256, which has an 88.5771 ns bit time. When the RTZ pulses are half that, they are 44.2885 ns wide. A 1 ppm error then corresponds to 44.2885 fs.
That is, when the pulse widths coming out of all FIRDAC taps change in the same direction by +/- 44.2885 fs depending on the previous bit value, that produces about the same low-level distortion as bohrok2610 has measured (and that appears to be filter-dominated).
What matters are pulse width changes depending on other data bits. If one tap systematically produces 50 ps wider pulses than the others, no matter what the previous bit was, it just reduces the stopband suppression of the FIRDAC.
Since it seemed not possible with LTSpice to simulate the odd spectral lines caused by HF modulation when playing low level signals, Marcel suggested to look at the Firdac’s summing point with the original OPA2210 filter module attached, instead of looking at the filter’s output signal.
And also to possibly make the cause of the problem even more clear to double the speed of the whole RTZ Firdac and sample each original DSD128 sample twice
The spectrum of an unloaded summing point, as well as a summing point loaded with a LC filter’s of several orders, starting either with Cap or Inductor, all simulated to the same 105dB S/N up to 20Khz, perfectly corresponding to real life measurements, so this seems to be a reliable simulation result.
I tried 18Mhz OPA2210's and LT1468's op-amps, the latter being a 5nV/rtHz low noise op-amp with a 90Mhz GBW, and for both cases the S/N came out correctly with the right S/N.
And although the 18Mhz OPA2210 model performed, it could be that LT1468 is be a better choice for the first stage to suppress the odd spectral lines because of its higher BW.
Setup
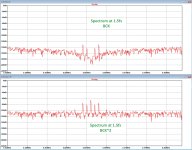
Since at the Firdac’s summing point there was no real difference visible between the spectra loaded with the OPA2210 or the LT1468 filter, only one set has been attached from resp. the spectrum zoomed in to 10Mhz, and the even further zoomed in spectra at 0.5fs, fs and 1.5fs.
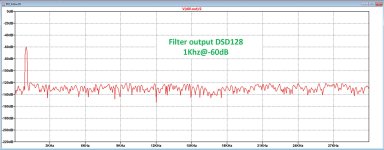
Attachment 1, Spectrum up to 30Khz after the OPA2210 filter, confirming the correct functioning of the simulation model.
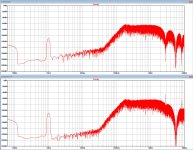
Attachment 2, Time Spectra at the Firdacs summing point.
Upper image part driven with BCK , lower part with double BCK repeating each input sampled twice.
See the high level spectral lines around 0.5fs and 1.5fs in the lower image, far above the above the same spectral lines when using the original BCK since its attenuation at the fs/2 is no longer there.
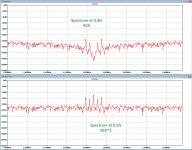
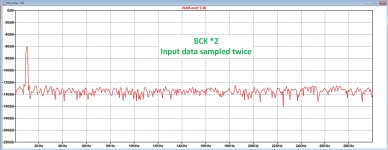
Attachment 3, Zoomed in at the spectrum around the original 0.5fs
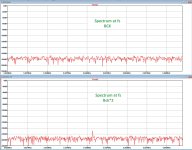
Attachment 4, zoomed in around the original fs
Attachment 5, zoomed in around the original 1,5fs.
In any case, the idea of lifting the spectral lines by sampling the input data twice with a clock at twice the original BCK, made the spectral lines 0.5fs and 1.5fs raise by 60 to 70 dB, as visible in the attachments 3 and 5.
But now looking at the filtered spectrum, the filter with op-amps gave crazy results maybe because of overloading its input, that's why I used a 4th order LC filter instead.
With this filter no signs of modulation products are visible, see sixth attachment.
So in this case LTSpice doesn't have the right op-amp models to replicate what's happening in real life when huge amounts of HF are added to the signal.
Hans
And also to possibly make the cause of the problem even more clear to double the speed of the whole RTZ Firdac and sample each original DSD128 sample twice
The spectrum of an unloaded summing point, as well as a summing point loaded with a LC filter’s of several orders, starting either with Cap or Inductor, all simulated to the same 105dB S/N up to 20Khz, perfectly corresponding to real life measurements, so this seems to be a reliable simulation result.
I tried 18Mhz OPA2210's and LT1468's op-amps, the latter being a 5nV/rtHz low noise op-amp with a 90Mhz GBW, and for both cases the S/N came out correctly with the right S/N.
And although the 18Mhz OPA2210 model performed, it could be that LT1468 is be a better choice for the first stage to suppress the odd spectral lines because of its higher BW.
Setup
- For this specific set of simulations I used 2 different loadings at the Firdac’s summing point,
1) the original filter with 18Mhz OPA2210 and 2) same filter with 90Mhz LT1468 - File used was a 1Khz@-60dB .dsf file as provided by Bohrok.
- Simulation time window was 16msec giving a 62.5Hz bin width.
- Signal was sampled in all cases with a 2^24 point FFT, giving a 500Mhz BW to prevent as much as possible aliases polluting the signal in the band of interest
Since at the Firdac’s summing point there was no real difference visible between the spectra loaded with the OPA2210 or the LT1468 filter, only one set has been attached from resp. the spectrum zoomed in to 10Mhz, and the even further zoomed in spectra at 0.5fs, fs and 1.5fs.
Attachment 1, Spectrum up to 30Khz after the OPA2210 filter, confirming the correct functioning of the simulation model.
Attachment 2, Time Spectra at the Firdacs summing point.
Upper image part driven with BCK , lower part with double BCK repeating each input sampled twice.
See the high level spectral lines around 0.5fs and 1.5fs in the lower image, far above the above the same spectral lines when using the original BCK since its attenuation at the fs/2 is no longer there.
Attachment 3, Zoomed in at the spectrum around the original 0.5fs
Attachment 4, zoomed in around the original fs
Attachment 5, zoomed in around the original 1,5fs.
In any case, the idea of lifting the spectral lines by sampling the input data twice with a clock at twice the original BCK, made the spectral lines 0.5fs and 1.5fs raise by 60 to 70 dB, as visible in the attachments 3 and 5.
But now looking at the filtered spectrum, the filter with op-amps gave crazy results maybe because of overloading its input, that's why I used a 4th order LC filter instead.
With this filter no signs of modulation products are visible, see sixth attachment.
So in this case LTSpice doesn't have the right op-amp models to replicate what's happening in real life when huge amounts of HF are added to the signal.
Hans
Attachments
@gentlevoice
Some scope probe possibilities:
https://jahonen.kapsi.fi/Electronics/DIY 1k probe/
https://www.sigcon.com/Pubs/straight/probes.htm
https://hackaday.io/project/184924-diy-13-ghz-fet-probe
Regarding 200MHz scopes and, say, an 11MHz BCLK, square waves consist of odd harmonics, and you probably would want to see at least the first 2 harmonics, which would be the 3rd and the 5th, at 33MHz and 55MHz respectively. So, you ought to be able to see a reasonably square looking wave (plus or minus the normal scope distortion spec of course).
Regarding measuring risetime accurately, that would be another matter since it could be around 1ns or less. https://www.tek.com/en/support/faqs/how-bandwidth-related-rise-time-oscilloscopes
Last edited:
In any case, the idea of lifting the spectral lines by sampling the input data twice with a clock at twice the original BCK, made the spectral lines 0.5fs and 1.5fs raise by 60 to 70 dB, as visible in the attachments 3 and 5.
But now looking at the filtered spectrum, the filter with op-amps gave crazy results maybe because of overloading its input, that's why I used a 4th order LC filter instead.
With this filter no signs of modulation products are visible, see sixth attachment.
An LC filter made of ideal components is linear and time invariant, so it cannot create intermodulation components. That's as expected.
I'm curious what your crazy spectrum at the output of the op-amp filter looks like. With 60 dB larger spectral lines around fs/2 and its odd multiples at the summing points, second order intermodulation products at the op-amp outputs should increase by 120 dB if nothing clips (to be more precise, if the second-order term still dominates). It is very well possible that the distortion gets larger than the intended signal.
By the way, using the normal clocking but changing the value of one FIRDAC resistor a bit (such that it doesn't match the others anymore) could be a way to increase the stuff around fs/2 by less than 50 dB ... 70 dB.
Last edited:
- Home
- Source & Line
- Digital Line Level
- Return-to-zero shift register FIRDAC