Comparing model with datasheets

Member
Joined 2020
Hello All,

My first post in this (or a) forum :)...

I'm working on a circuit where I discovered that the behavior in spice simulations is quite different from what I find in reality. Of course, this is no news to most here...
But my question is, maybe I'm missing something in the LTspice settings since my results are not even close to the diagrams I'm getting with LTspice?

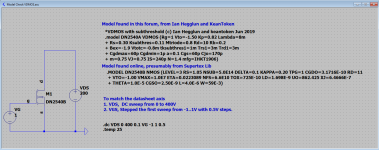
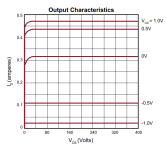
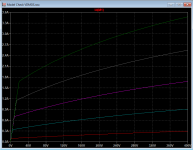
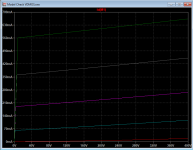
Attached are the screenshots and .asc file used to give the overview.

I'm hoping somebody will share some insight here,
Best regards, Rens.
 

Attachments

  • DN2540 LTSpice Test.png
    DN2540 LTSpice Test.png
    29.8 KB · Views: 44
  • DN2540 Datasheet Curve Id.png
    DN2540 Datasheet Curve Id.png
    12.5 KB · Views: 46
  • DN2540 Model A.png
    DN2540 Model A.png
    10.4 KB · Views: 38
  • DN2540 Model B.png
    DN2540 Model B.png
    9.3 KB · Views: 44
  • Model Check VDMOS.asc
    1.6 KB · Views: 18
Member
Joined 2022
The power dissipation is far over the ratings.

I see that the threshold voltage is -1.5V in one model and -1.0V in the other. This parameter is not well-controlled.
Ed
 
Member
Joined 2020
Hello Jan, Hi Ed,

Thanks for your help. I’ll give that a try.
Ed, you’re right, however the used Vds and Vgs are exactly the same as in the datasheet, so I expected to get a simular diagram as per datasheet as a starting point.

@keantoken ; Would you be so kind and try shed some light on this subject?

BR. Rens.
 
Last edited:
Member
Joined 2020
Hi Jan. As a newbie here I’m still under moderation and with that no PM’s are allowed. I hoped mentioning with the @ flag would sent a personal trigger. But otherwise I’ll await the moderators confirmation of me being a human :). Br. Rens.
 
  • Like
Reactions: 1 user
Member
Joined 2020
Hi Ed, you’re right there.

However, I’m hoping to get some more background on how the simulation is so far away from the datasheets. It’s absolute values, knee’s and slopes are all different, so I suspect I’m doing or am understanding something wrong here…
 
Member
Joined 2022
Your understanding is fine. The datasheet graph looks suspicious (Id has zero slope and quickly falls short of the square-law). The models don't try to represent varying device parameters.
Ed
 
Top