Hello,
I'm not sure I'm reading the frequency graph correctly when I compare it to the text technical specifications.
For example, I will post screenshots from official documents, and show you how I read the graph.
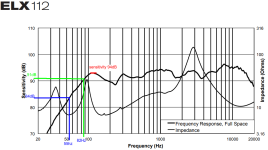
Specs of Electro-Voice ELX112 from the official manual:
https://products.electrovoice.com/binary/Live_X_Passive_Loudspeaker_Owners_Manual.pdf
Freq. Response (-3 dB): 82 Hz - 18 kHz
Freq. Range (-10 dB): 55 Hz - 20 kHz
Axial Sensitivity: 94 dB
The colored lines are drawn by me to show how I read the chart.

Here everything looks fine to me
But I have a problem when reading e.g. EV ELX118
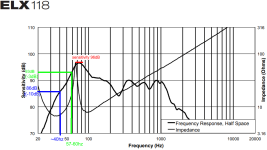
Freq. Response (-3 dB): 50 Hz - 100 Hz
Freq. Range (-10 dB): 35 Hz - 200 Hz
Axial Sensitivity: 96 dB

In my opinion, if the sensitivity is 96dB (in this case given as maximum), we get the following values from the graph:
57hz@-3db (93dB)
40hz@-10dB (86dB)
For the results to match, the sensitivity should be ~90dB in my opinion.
Or should it be written that the SPL is 90dB and the maximum is 96dB@75hz?
Could you explain this to me, please?
The next example is FBT CS1000
https://storage.googleapis.com/fbt-...000->ATTACHMENTS->Datasheet_Vertus_CS1000.pdf
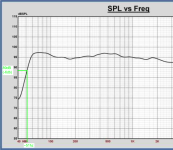
Frequency Response @ -6dB : 40Hz-20kHz

Looking at the graph, I can assume that the SPL is 95dB. I'm right?
This means that for -6db (89dB) the frequency is ~51hz, not 40hz as written in the technical documentation. How should I interpret this result?
Best regards
I'm not sure I'm reading the frequency graph correctly when I compare it to the text technical specifications.
For example, I will post screenshots from official documents, and show you how I read the graph.
Specs of Electro-Voice ELX112 from the official manual:
https://products.electrovoice.com/binary/Live_X_Passive_Loudspeaker_Owners_Manual.pdf
Freq. Response (-3 dB): 82 Hz - 18 kHz
Freq. Range (-10 dB): 55 Hz - 20 kHz
Axial Sensitivity: 94 dB
The colored lines are drawn by me to show how I read the chart.

Here everything looks fine to me
But I have a problem when reading e.g. EV ELX118
Freq. Response (-3 dB): 50 Hz - 100 Hz
Freq. Range (-10 dB): 35 Hz - 200 Hz
Axial Sensitivity: 96 dB

In my opinion, if the sensitivity is 96dB (in this case given as maximum), we get the following values from the graph:
57hz@-3db (93dB)
40hz@-10dB (86dB)
For the results to match, the sensitivity should be ~90dB in my opinion.
Or should it be written that the SPL is 90dB and the maximum is 96dB@75hz?
Could you explain this to me, please?
The next example is FBT CS1000
https://storage.googleapis.com/fbt-...000->ATTACHMENTS->Datasheet_Vertus_CS1000.pdf
Frequency Response @ -6dB : 40Hz-20kHz

Looking at the graph, I can assume that the SPL is 95dB. I'm right?
This means that for -6db (89dB) the frequency is ~51hz, not 40hz as written in the technical documentation. How should I interpret this result?
Best regards
I find it useful to consider it in terms of the sensitivity of the system which can be achieved with it.. and that means I don't have the answer until it's in a box and I've worked on crossing it. This also means I've chosen how low to let it run since it's often possible to get a little extra if you sacrifice f3.
There's reasonable justification for using a best-fit flat line definition of the sensitivity in the passband, then take -3dB from that to define the ends of the band. The wiggles across the passband have an average, and that will be more inline with perceived sensitivity than the highest peak has.
At least you've got the graph to look at and can evaluate according to your own criterion.
At least you've got the graph to look at and can evaluate according to your own criterion.