@DonVK, @fluid: If you have any frequency response plots from when you did initial simulations, can we use them to see the overall directivity plot in VituixCAD with vertical measurements included?
I am a bit curious about how much more the DI will rise across the spectrum with the verticals included
I am a bit curious about how much more the DI will rise across the spectrum with the verticals included
So the same spectrogram plot as above with the dynamic range in SPL restricted to 30dB (Looks much decent now from before...  )
)

For reference here is what happens with 40dB of dynamic range (Looks pretty messy now... ?)

How about 25dB dynamic range

Is there a standard way of doing this?
How much level of separation do we want to see between our intended signal & all sorts of nonsense either from the measurement method/setup or caused by some form of distortion?
I understand that ideally, we want to have as much of the signal and no nonsense as possible. But in practice, how much is enough? 20dB of separation, 30dB?
It is amazing how much these plots can bias us in all sorts of wrong directions when dont look at it the 'right way' (if at all there is one)
)For reference here is what happens with 40dB of dynamic range (Looks pretty messy now... ?)
How about 25dB dynamic range
Is there a standard way of doing this?
How much level of separation do we want to see between our intended signal & all sorts of nonsense either from the measurement method/setup or caused by some form of distortion?
I understand that ideally, we want to have as much of the signal and no nonsense as possible. But in practice, how much is enough? 20dB of separation, 30dB?
It is amazing how much these plots can bias us in all sorts of wrong directions when dont look at it the 'right way' (if at all there is one)
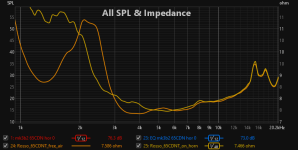
Now looking at the impedance in more detail

Definitely things happening around 16kHz (probably break up resonance if the Rosso driver)?
What is that bump around 8kHz? (since 16kHz tone is the 2nd harmonic of the 8kHz)? Maybe this has something to do with the spectral decay madness around 8kHz that we have been debating about?
Looking at distortion products again

There is definitely some low level spiking of distortion around 8kHz. What is that?? (breakup resonance amplification of distortion products??) Maybe the effects also come out in the spectral decay as those ridges in energy decay but at a level 20-25dB less than the signal?
Definitely things happening around 16kHz (probably break up resonance if the Rosso driver)?
What is that bump around 8kHz? (since 16kHz tone is the 2nd harmonic of the 8kHz)? Maybe this has something to do with the spectral decay madness around 8kHz that we have been debating about?
Looking at distortion products again
There is definitely some low level spiking of distortion around 8kHz. What is that?? (breakup resonance amplification of distortion products??) Maybe the effects also come out in the spectral decay as those ridges in energy decay but at a level 20-25dB less than the signal?
Attachments
I am not having any luck getting that to work in the way it normally does. The vertical is losing or gaining directivity at about 2K relative to the horizontal so it will rise from there. You can just look at the Horizontal DI in Vituix and this will be accurate.@DonVK, @fluid: If you have any frequency response plots from when you did initial simulations, can we use them to see the overall directivity plot in VituixCAD with vertical measurements included?
I am a bit curious about how much more the DI will rise across the spectrum with the verticals included
If you do take vertical measurements for use in Vituix they must match the horizontal, i.e +/-90 or +/-180, you cannot mix the two or it screws things up.
Btw, the sims and measurements are for a free-standing horn. The example design I provided does not add much material around the native inner profile. You could tune especially the vertical a little bit by making the horn wider vertical wise and make an appropriate round-over. Or you could place the horn in a bass cabinet. I have seen a rounded front (to cover the dimensions of the curved horn mouth surface) somewhere here but cannot remember where to find.
To measure a bare CD, the best method is with a PWT and gate the measurements based on the tube length. This will show any driver misbehaviour.@fluid: We haven't taken raw measurement of the CD yet. Will try to take it soon..
So the same spectrogram plot as above with the dynamic range in SPL restricted to 30dB (Looks much decent now from before...
For reference here is what happens with 40dB of dynamic range (Looks pretty messy now... ?)
How about 25dB dynamic range
Is there a standard way of doing this?
How much level of separation do we want to see between our intended signal & all sorts of nonsense either from the measurement method/setup or caused by some form of distortion?
I understand that ideally, we want to have as much of the signal and no nonsense as possible. But in practice, how much is enough? 20dB of separation, 30dB?
It is amazing how much these plots can bias us in all sorts of wrong directions when dont look at it the 'right way' (if at all there is one)
Its generally done the way you have found, by start changing the range to see is there are problems in the region of interest, and to see how "far down" the issue are w.r.t main signal. It's not a hard number, that was the reason for the range change in the CSD. Often problems also show up in the THD measurements and then you have a few pieces of data pointing to the issue.
Regarding suggestions to remove fins. This horn is designed to work with fins, Its part of the designed expansion profile. Removing them, or building without them, would not measure or operate correctly. There would be no point, other than wasting time or possibly damaging the horn.
Last edited:
I just have to giggle. How do you know it would make a difference for the worse? As it is now it doesn't operate correctly either.Regarding suggestions to remove fins. This horn is designed to work with fins, Its part of the designed expansion profile. Removing them, or building without them, would not measure or operate correctly. There would be no point, other than wasting time or possibly damaging the horn.
BTW, I didn't suggest to remove the fins from this horn. That was a joke, given how tediuous it was to build it.
Just looked around for other measurements of the Rosso 65 CDN-T driver and found Joseph Crowe's measurements of this driver.
Measurements taken on his ES 600 Biradial horn
Snapshot of test settings:

Results for burst decay (It seems like these are based on non-flattened raw measurements and captured from 33cm away with a gate duration of 3.84ms)

Comparing with our measurements (except for the non-normalized SPL scale but having the same 35 dB dynamic range) with similar axis limits especially the SPL axis

I can only see very similar trends between the two curves. The break-up resoance induced (?) decay ridges above 13kHz (main resonance peak about 16kHz) and the 8kHz ish resonance which is a subharmonic. It seems these artefacts are are just driver related.
Maybe someday I should try out a series notch like what Purifi has described here and see what happens or maybe not
https://purifi-audio.com/blog/app-notes-2/low-distortion-filter-for-ptt6-5x04-naa-11
Measurements taken on his ES 600 Biradial horn
Snapshot of test settings:
Results for burst decay (It seems like these are based on non-flattened raw measurements and captured from 33cm away with a gate duration of 3.84ms)
Comparing with our measurements (except for the non-normalized SPL scale but having the same 35 dB dynamic range) with similar axis limits especially the SPL axis
I can only see very similar trends between the two curves. The break-up resoance induced (?) decay ridges above 13kHz (main resonance peak about 16kHz) and the 8kHz ish resonance which is a subharmonic. It seems these artefacts are are just driver related.
Maybe someday I should try out a series notch like what Purifi has described here and see what happens or maybe not
https://purifi-audio.com/blog/app-notes-2/low-distortion-filter-for-ptt6-5x04-naa-11
Last edited:
Just look at the same driver response with the other (Faital) horn you've shown - it's relatively well-behaved up to 15 kHz. And then look at the responses measured with the printed horn - above 7 kHz it's just a mess for both drivers tested. Those are hardly driver-related artefacts. I completely understand the authors who are trying to save the day, it's their right to do, but let's face the truth... It seems these artefacts are are just driver related.
- I was very interested how will the fins work, as the idea is not stupid at all. I mean, it would be great if it worked, it could solve many problems. Unfortunately, as with many other things, it's not that simple (I had a similar experience with my shaping plug). That's the take-away for me from this experiment. Thanks for that!
The horizontal measurements in post #122 track very well with the simulations up to about 10 to 12K where beyond that, reality with a driver that does not have a flat wave front kicks in. I do not see it the same way that you do, so "truth" is dependent on your own perspective.let's face the truth
Let's not turn a positive thread sour.I completely understand the authors who are trying to save the day, it's their right to do
The graphs were power responses, so they are a function of SPL and beamwidth.
Just to clarify, the Hornresp power response is a function of solid radiation angle, not beamwidth.
It is the pressure response that is a function of directivity beamwidth.
@David McBean so power uses area (solid angle 2D, Steridians) vs pressure on beamwidth (1D, angle) ?
[edit] updated question after thinking about it, makes sense to differentiate solid angle and beamwidth
[edit] updated question after thinking about it, makes sense to differentiate solid angle and beamwidth
Last edited:
We (I and @vineethkumar01 ) are documenting our journey of my 2-way system here not to prove or disprove anything. I invite everyone to take what they can from this build and apply it to their own endeavours if useful. The main focus is on learning and progressing. The title of the thread is "2-way horn system based on the MK3B2," which signifies that testing the MK3B2 is just one of the steps in building this system., and not the sole purpose of the thread.
Our learning so far has been that PLA is highly resonant, damping doesn't help much. 3d printing is good to build a prototype, but best avoided in a permanent application.
My initial listening impressions of the horn have been satisfactory, with both the Rosso and the Faital CDs. The next step is to build the horn in wood and finalise the design of the bass cab. We shall measure the wooden horn when completed, in isolation, and also with the bass cab as a whole system.
Just so that anyone reading this thread in future will not be confused about the Rosso driver performance, here is my measurement and equalized flat-on-axis measurement of the Rosso driver (from the past) on the LTH 142 horn (This is a 4ms gated measurement compared to the 6.5ms measurements above). The SPL level at which this was taken is about 30ish dB lower than the SPL level at which @WetFartz measured this driver on the mk3b2.

Now here is the spectral decay for above settings (with same dynamic range in SPL as above)

I still see the driver-related artefacts around 8kHz & above 12kHz.
Also to not get confused about the normalized horizontal directivity of the mk3b2 as we measured with the Rosso driver (since I have multiple plots, some normalized and some not), here is that normalized plot (with or without the following EQ since the EQ doesn't change below shown normalized polars)


Edit:
Found the normalized polars on the LTH142 as well

Now here is the spectral decay for above settings (with same dynamic range in SPL as above)
I still see the driver-related artefacts around 8kHz & above 12kHz.
Also to not get confused about the normalized horizontal directivity of the mk3b2 as we measured with the Rosso driver (since I have multiple plots, some normalized and some not), here is that normalized plot (with or without the following EQ since the EQ doesn't change below shown normalized polars)
Edit:
Found the normalized polars on the LTH142 as well
Last edited:
- Home
- Loudspeakers
- Multi-Way
- 2-way horn system based on the MK3B2