A few results from a daytime run.
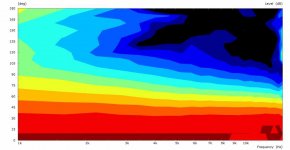
After removing the interface, with a full enclosure there still appeared some spikes in the HF. But the good news: over most of the simulation, the results stayed the same, any differences are probably attributable to the additional enclosure surface. So the spikes can be ignored:
quarter symmetry:
half symmetry:
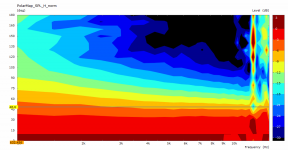
The pattern is generally a bit more compressed, losing some degrees of coverage. What a pitty, must I widen it again. One observation I found most interesting, when I looked at SPL graphs: Most of the off-axis excess bump that we see with an enclosure is happening at only a few angles, 50 and 60 degrees in this case (orange, lilac):
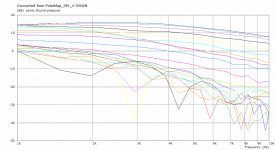
Overall performance s'well:
horizontal , vertical with known issue.
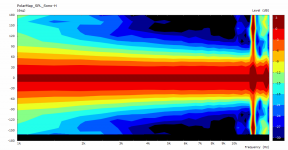
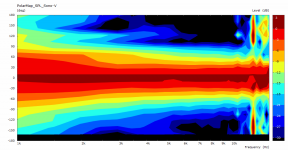
Btw, the pattern of the vertical up does not widen to much, so it competently controls almost to the crossover frequency. This is good.
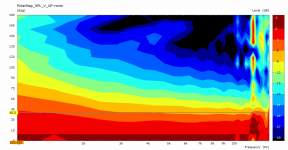
After removing the interface, with a full enclosure there still appeared some spikes in the HF. But the good news: over most of the simulation, the results stayed the same, any differences are probably attributable to the additional enclosure surface. So the spikes can be ignored:
quarter symmetry:

half symmetry:

The pattern is generally a bit more compressed, losing some degrees of coverage. What a pitty, must I widen it again. One observation I found most interesting, when I looked at SPL graphs: Most of the off-axis excess bump that we see with an enclosure is happening at only a few angles, 50 and 60 degrees in this case (orange, lilac):

Overall performance s'well:
horizontal
 , vertical with known issue.

Btw, the pattern of the vertical up does not widen to much, so it competently controls almost to the crossover frequency. This is good.

Last edited:
I wish I was smart enough to participate in this thread 🙂. It's been fun being a spectator, though.
You don't have to be smart to use Ath 🙂
- Find a new feature:


- Find a new feature:
Last edited:
@mabat
Is that not possible to define an enclosure this way:
Also the first Spacing value is ignored in this case?
Is that not possible to define an enclosure this way:
Code:
xP0 = 200;
r   = 100;
my_plan = {
  point  P0 xP0 0 5
  point  P1 (xP0+r) r 8
  point  PB 0 (xP0+2*r) 20 ;
  cpoint C1 xP0 r
  cpoint C2 0 r
  arc P0 C1 P1
  arc P1 C2 PB
}
Also the first Spacing value is ignored in this case?
Code:
box = {
point P0 100 0 5
point P1 140 20 8
point P2 100 250 10
point PB 0 250 10
bezier P0 P1 P2 PB
}

Plan = box
Spacing = 00,20
}There is possibly not a command with which one could disable the rounding on the back wall corners?
- Now I need to find a way how to make the woofer a second source. Then the full polar data for a crossover simulation could be generated. That could answer a lot of questions regarding power response wrt a MTM setup, etc.


For woofers it is quite obviously different when looking at field plots but not for waveguides.No, as the effect was shown to be very small.
You can create a custom plan with and without the back rounding. At the moment, it only won't be rounded at the top/bottom (that's still in the pipeline).
From the Akabak3 manual:
so for ATH4 simulations with radiators 1-2" diameter the far field distance is set to 2.54 - 5.08m. For some of my simulations of midrange horns in Akabak I have manualy specified 10m far field distance as the mouth dimension is over 1m.
Distance
Distance is the radius of the circular arc on which observation points are distributed.
Far Field: if checked then the simulation is carried out at a large distance. Eventually the amplitude is scaled to specified Distance and the phase to zero-distance.
Far-Field Distance: here you can specify the "large" distance for approximating far-field conditions. If left empty 100 times the size of the radiator is used as far-field distance.
so for ATH4 simulations with radiators 1-2" diameter the far field distance is set to 2.54 - 5.08m. For some of my simulations of midrange horns in Akabak I have manualy specified 10m far field distance as the mouth dimension is over 1m.
Funny thing is that one can simulate a MTM cabinet with a smaller model (1/4) than a TM cabinet (1/2).

BTW, vertical polars of the above, just the woofers driven (246 x 586 x 200 mm) -

The same for only the WG driven (both polar maps normalized on-axis).
(Obviously not a good match.)

(Obviously not a good match.)
I wish I was smart enough to participate in this thread 🙂.
Just do it! It's a tool, others did the science.You don't have to be smart to use Ath 🙂
Speaking of, thanks again, mabat. After I had the chance to see the waveguide in an enclosure, I think that within its limits, it does exactly what it was intended to do, and quite competently. In my currrent enclosure planned, it allows for a 29 cm separation, which is around 1.1 lambda I guess.
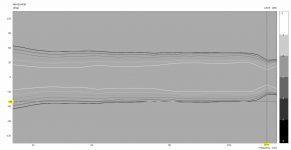
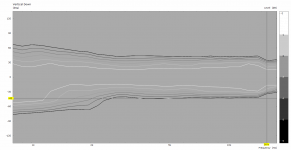
I am rather concerned with my own design assumptions. I have created a flat directivity index. The vertical pattern could be a bit brigth, when looking at the off-angles.
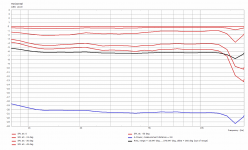
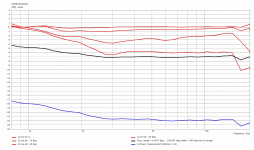
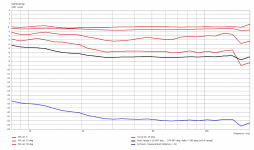
I am thinking of doing another version with a mild tilt. Can someone tell me: the A-Power and Rms curve do relate to? Rms can be set to 2Pi, here it is full space.
Edit: one more question, is it possible to see the combined power response of all both horizontal and vertical axes in VCAS? Which BE-Spectrum command brings me there?
Last edited:
Just do it! It's a tool, others did the science.
Speaking of, thanks again, mabat. After I had the chance to see the waveguide in an enclosure, I think that within its limits, it does exactly what it was intended to do, and quite competently.
View attachment 1040391 View attachment 1040392
I am rather concerned with my own design assumptions. I have created a flat directivity index. The vertical pattern could be a bit brigth, when looking at the off-angles.
View attachment 1040394 View attachment 1040395 View attachment 1040396
I am thinking of doing another version with a mild tilt. Can someone tell me: the A-Power and Rms curve do relate to? Rms can be set to 2Pi, here it is full space.
I’ve tended towards fig 10 & 11 in @gedlee directivity paper. I made the choice for a 3:2 ratio rectangle and tweaked for what seemed forever to arrive at Project2 waveguide. Still not quite there. Project3 maybe…. Love your grey/white charts by the way!
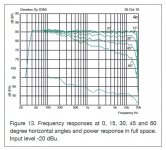
I’m running a few tests 1K-4K to see if there are any mesh settings causing this bump. Cabinet horizontal attached. I tried to match SEOS chart style and range.
Attachments
Last edited:
Yes. In did this after the JBL PT-waveguides, they where not narrowing all the way up,so flat!!
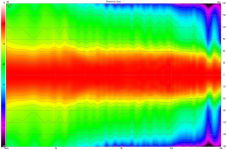
and I knew how they sounded.
However, there was much discussion about the need to attenuate the listening axis. Other manufacturers than JBL obviously prefer a narrowing pattern for their controlled directivity waveguides:
So I came to question, if a flat DI is really ever so nice. Something with a slight tilt, maybe, not too much.
I’m running a few tests 1K-4K to see if there are any mesh settings causing this bump.
Note that my scale was set to +135/-135. A had forgotten to change this after I went for the new chart style. Yours would look better this way, too. Also, your low cossover point is accentuating diffraction. Have you tried to export the spectra from VCAS and combined the waveguide polars with your woofer polars? Search for vituix in this thread and you will find a renaming script from fluid to import the curves into VCad.
I tried to match SEOS chart style and range.
Though I do not know whats the benefit: what is the command in BE_Sepctrum?
Last edited:
Still not quite there. Project3 maybe…. Love your grey/white charts by the way!
I’m running a few tests 1K-4K to see if there are any mesh settings causing this bump.
As soon as you have found your set of parameters, in which the value of N is giving a straight response for 5k area, here is the direction then: I found that both Parameter S and N must be reduced at the same time. This might at first seem counter intuitive, as usually, a smaller S is giving a tight waistbanding effect in LF, but in this case, a higher S also creates the bump above the ditch. When you reduce it, and also N, which has the effect of widening the LF over a wider band, you can work against the effect you see in your simulation. With some tuning of coverage angle, this will probably lead to success.
I had the same phenomenon when I worked on a waveguide with more tilted DI, and found this fix only late. I have interrupted this work now, but I assume this is the proper direction.
Is there a way to export the enclosure plan and to compare it against what is expected?
I tried this:
And I got this:

While I was expecting this using an implementation of the Bezier function from Octave:

I tried this:
Code:
[x, y]           = ROSSE
YEnclosure = max(y) - y ;
Code:
;ROSSE Enclosure
box = {
point P0    102.50    0.0000    5
point P1    113.51    1.0852    5
point P2    123.05    4.0440    5
point P3    130.70    8.4766    5
point P4    136.09    14.039    8
point P5    139.02    20.439    8
point P6    139.57    27.432    8
point P7    138.03    34.813    8
point P8    134.79    42.416    8
point P9    130.24    50.111    8
point P10    124.68    57.792    8
point P11    118.32    65.383    10
point P12    111.33    72.826    10
point P13    103.82    80.082  10
point P14    95.868    87.125    10
point P15    87.538    93.938    10
point P16    78.871    100.51    10
point P17    69.897    106.82    10
point P18    60.643    112.85    10
point P19    51.125    118.56    10
point P20    41.359    123.88    16
point P21    31.355    128.67    16
point P22    21.122    132.72    16
point P23    10.669    135.72    16
point PB    0.0000    137.30    16
bezier P0 P1 P2 P3 P4 P5 P6 P7 P8 P9 P10 P11 P12 P13 P14 P15 P16 P17 P18 P19 P20 P21 P22 P23 PB
}

Mesh.Enclosure = {
Plan = box
Spacing = 00,20
}
And I got this:
While I was expecting this using an implementation of the Bezier function from Octave:
Last edited:
- Home
- Loudspeakers
- Multi-Way
- Acoustic Horn Design – The Easy Way (Ath4)
