that was it! thanks!Try to disable the STL output in your WG script (Output.STL = 0), otherwise I have no idea.
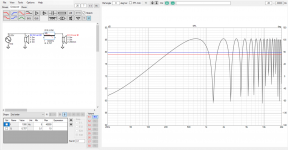
That seems to be the sound traveling around the waveguide. ......
If so, hence the cut... but 0,26 seems more like throat -> edge - throat - no?
//
Roughly, if the data is taken rotating the DUT around axis that goes through the source you can now imagine what happens when mic is behind the device, 180deg. Sound from the source needs to go outwards first to go around mouth and diffract (go around) towards the mic. Simple pythagorean math gives good estimate of the path length. Or roughly distance from throat to edge and back as you estimate.
Last edited:
It turns out that VACS makes a lot of it automatically and "resamples" and interpolates/smoothens the data if necessary. So probably a lot can depend on VACS settings. This is what I found (haven't changed anything):

If I decrease the number of frequencies in ABEC, I still get a similar IR, with the same number of points, only smoothed (i.e. less accurate).
If I decrease the number of frequencies in ABEC, I still get a similar IR, with the same number of points, only smoothed (i.e. less accurate).
I suppose that non of this simulate any bending wave mode sound from a WG - is that correct? That would need a mechanical-mechanical interface between the driver and the WG to be described and also perhaps the aspect of the pressure wave energy transfer to theWG itself - i.e. loss... but "regained" perhaps - in an unfavourable manner!?
//
//
Yes, all the boundary elements are considered perfectly rigid.I suppose that non of this simulate any bending wave mode sound from a WG - is that correct?
Last edited:
coughSorry to bother you all again with a technical troubleshooting question, I hope this can be my last: is someone currently and successfully extracting virtual spin data / FRDs from Ath on a Windows 11 machine that has uncompromised phase?
not a single soul?
I'm still on windows 10 to my knowledge, had weird phase early this year but now it seems to work fine and I did seemingly nothing. I don't remember what settings I was using with bad phase. Just in case here is fresh config file, just add a R-OSSE definition and try it. I have used this succesfully recently, on a windows 10.
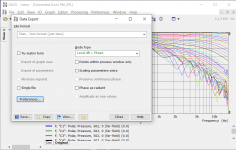
In VACS, Graph > Convert curves <-> contour and then right click on the graph and from the popup menu click export data... I believe export settings are stock but just in case here is a screenshot. Hit the save button, rename the files and import to VituixCAD.

The data I'm exporting is normalized, perhaps that has got to do with it?
When you import the responses to VituixCAD the on-axis response sits 0db because of normalization. Use the db scaling field located below the drivers responses to scale them up to realistic level, like 95db or so.
Code:
Mesh.LengthSegments = 60
Mesh.AngularSegments = 8
Mesh.SubdomainSlices =
Mesh.WallThickness = 5
Source.Shape = 1
ABEC.SimType = 2
ABEC.SimProfile = 0
ABEC.MeshFrequency = 43000
ABEC.NumFrequencies = 100
ABEC.Abscissa = 1
ABEC.f1 = 200
ABEC.f2 = 20000
ABEC.Polars:SPL = {
 MapAngleRange = 0,180,37
 Offset=0
 NormAngle = 0
}
ABEC.Polars:H = {
 MapAngleRange = 0,180,13
 Offset=0
 NormAngle = 0
}
Output.ABECProject = 1
Output.STL = 0
Report = {
 Title = a waveguide
 Width = 1600
 Height = 1000
 GnuplotCode = 2x2n+w.gpl
}
In VACS, Graph > Convert curves <-> contour and then right click on the graph and from the popup menu click export data... I believe export settings are stock but just in case here is a screenshot. Hit the save button, rename the files and import to VituixCAD.

The data I'm exporting is normalized, perhaps that has got to do with it?
When you import the responses to VituixCAD the on-axis response sits 0db because of normalization. Use the db scaling field located below the drivers responses to scale them up to realistic level, like 95db or so.
Last edited:
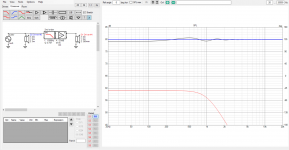
That process will give the phase with the propagation delays included which makes it look all wrapped and weird. Removing the fixed delay in VACS or letting Vituix make it minimum phase will make it look nicer.
Alright played with the backside some.
If someone wants to make such waveguide that has enclosing backside to eliminate diffraction altogether, then I suggest to optimize the R-OSSE definition by using tmax > 1 first. Then, if the backside did not end up practical to build use the new bezier backside definition or Profile coordinates file to shape the backside further to make it more practical.
Here is profile I came up with for my project, backside is done by tmax so no tricks. Graphs show no diffraction, about target DI.
View attachment 1129227View attachment 1129228
Not sure if its coincidence or not but a bezier curve seems to match almost perfectly tmax backside with the R-OSSE definition here. I used Desmos as reference to match the bezier to R-OSSE tmax and then script to make these sims. Custom script is output here and seems to be working as results match above.
View attachment 1129229View attachment 1129230
Following are some manipulations of the backside, making it longer and rounder and so on compared to backside made with just tmax. As you see the waves on the fall plot are due to sound going all the way around the waveguide and can be minimized by manipulating shape of the backside. I think these are getting almost as good as it gets because we cannot stop sound propagating around freestanding object so some of the wavyness will stay no matter what
Rounder back, same depth, kind of apple shape
View attachment 1129231View attachment 1129232
Rounder and elongated back
View attachment 1129233View attachment 1129234
This is just elongated back
View attachment 1129235View attachment 1129236
Little bit less elongation
View attachment 1129237View attachment 1129238
More pointy back
View attachment 1129239View attachment 1129240
edit. for completeness sake here the same R-OSSE profile without backside, tmax=1 so edge diffraction effects are visible.
View attachment 1129243View attachment 1129244
I came up with these:
This one has a marked transition between the WG and the rear enclosure but according to the metric I use is better.
Code:
R-OSSE = {
  R     = 131.97 ; [mm]
  a     = 29.968 ; [deg]
  r0    = 12.7 ; [mm]
  a0    = 10.5 ; [deg]
  k     = 2.5741 ; []
  r     = 0.68519 ; []
  m     = 0.41273 ; []
  b     = 0.42454 ; []
  q     = 1.1489 ; []
  tmax  = 0.91745 ; []
         }

  Rot   = 0.56895 ; [deg]

Source.Shape         = 1

; -------------------------------------------------------
; Mesh Settings
; -------------------------------------------------------
Mesh.LengthSegments  = 50
Mesh.SubdomainSlices =
Mesh.WallThickness   = 5
Mesh.RearShape       = 5
Mesh.RearCubic = -138.4, 0, 52.373, -76.085, 1.1553 ; [mm]
and with smoother transition from the WG to the rear enclosure:
Code:
R-OSSE = {
  R     = 129.21 ; [mm]
  a     = 29.514 ; [deg]
  r0    = 12.7 ; [mm]
  a0    = 10.5 ; [deg]
  k     = 2.6087 ; []
  r     = 0.6861 ; []
  m     = 0.43135 ; []
  b     = 0.14267 ; []
  q     = 1.1374 ; []
  tmax  = 0.916 ; []
         }

  Rot   = 2.0004 ; [deg]

Source.Shape         = 1

; -------------------------------------------------------
; Mesh Settings
; -------------------------------------------------------
Mesh.LengthSegments  = 50
Mesh.SubdomainSlices =
Mesh.WallThickness   = 5
Mesh.RearShape       = 5
Mesh.RearCubic = -137.31, 0, 52.326, -77.187, 9.0474 ; [mm]
Comparison:
Changing the Rot value within reason can more or less increase or decrease the effective coverage angle.
Last edited:
Hi,cough
not a single soul?
Sorry I don't have a win11 machine but at least I can provide you with a script that I used:
Code:
R-OSSE = {
  R     = 129.21 ; [mm]
  a     = 29.514 ; [deg]
  r0    = 12.7 ; [mm]
  a0    = 10.5 ; [deg]
  k     = 2.6087 ; []
  r     = 0.6861 ; []
  m     = 0.43135 ; []
  b     = 0.14267 ; []
  q     = 1.1374 ; []
  tmax  = 0.916 ; []
         }

  Rot   = 2.0004 ; [deg]

Source.Shape         = 1

; -------------------------------------------------------
; Mesh Settings
; -------------------------------------------------------
Mesh.LengthSegments  = 100
Mesh.SubdomainSlices =
Mesh.WallThickness   = 5
Mesh.RearShape       = 5
Mesh.RearCubic       = -137.31, 0, 52.326, -77.187, 9.0474 ; [mm]

; -------------------------------------------------------
; ABEC Project Settings
; -------------------------------------------------------
ABEC.SimType         = 2
ABEC.SimProfile      = 0
ABEC.f1              = 625    ; [Hz]
ABEC.f2              = 20000    ; [Hz]
ABEC.NumFrequencies  = 100
ABEC.MeshFrequency   = 40000    ; [Hz]

ABEC.Polars:SPL      = {
MapAngleRange        = 0,180,37 ; 5deg resolution
                       }
This script should give you minimum phase as plotted here:
Bottom right corner is the phase straight from the complex SPL (which should be minimum phase).
Bottom left corner is the same phase with a manually added equivalent 2m of time delay.
Maybe that can give you some clues.
Here's a recap regarding phase data:
- If you specify Distance in ABEC.Polars, FRs are simply calculated at that distance from the origin and VACS phases include all the propagation delays (may seem "weird" due to wrapping but they are correct). Ath currently removes the delay corresponding to this distance automatically in the FRD export function. This is the recommended way how to obtain the data for a crossover simulation. Don't use any PhaseComp unless you know what you're doing.
- If you don't specify Distance in ABEC.Polars, ABEC produces "far field" FR and compensates the phases for the distance used, but as this far field is not always as far as you might expect, it's generally not recommended for multiple sources.
P.S. ABEC doesn't calculate minimum phase, it's not making such assumption. Calculated phase response may resemble a minimum phase one but it's really just a true phase, compensated for the propagation delay.
Remember that a true delay (as a propagation delay) just adds a linear tilt to the phase response and as such can be easily removed (even from heavily wrapped/"weird" data). What's important is to keep the polars from various sources at the same origin and distance. Such data should be used directly in a crossover simulator without any additional setting of relative positions of the sources.
Last edited:
It's interesting how even a small diffraction at the outer edge narrows the directivity for the lower frequencies.and with smoother transition from the WG to the rear enclosure:
Perhaps it's not that mystical after all - it seems to increase the apparent overall size of the source where the wavelengths are long enough.
So this is my take away - if you want as wide directivity as possible, eliminate all the diffraction. If you want to narrow the beamwidth, use it wisely 🙂
Last edited:
Today I have been able to do it by putting ABEC into Windows 8 compatibility mode. Right click on the desktop shortcut and select compatibility to get to the option. It now solves for me on Windows 11 without any issue and the FRD export works as far as I can tell. This is Maiky's script above.cough
not a single soul?
Did you try with Win11 native?Today I have been able to do it by putting ABEC into Windows 8 compatibility mode. Right click on the desktop shortcut and select compatibility to get to the option. It now solves for me on Windows 11 without any issue and the FRD export works as far as I can tell. This is Maiky's script above.
View attachment 1131059
If the phase on the top right is for 00deg then it seems that there is a +/-4.0mm offset (+/-85deg of added phase @20kHz) compared to the raw output of ABEC or am I missing something?
The LF interpolation/Hilbert (or whatever VCad is doing) does not seem to be trustworthy for far off axis data.
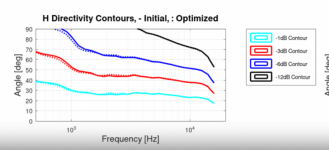
You are right that effect is mostly on the low frequencies and that is because there is less highs to the edge so less interference with direct sound. But, the comparison graphs seem to indicate response is narrower with the optimized profile though, if I interpret it correctly. Blue before - red after, and device with the abrupt curve change looks to have wider response <2kHz. Conclusion I agree with, strongest interference from diffraction happens ~object size wavelength and the effect is narrowing response, same thing happens to direct radiating drivers on a baffle, main diffraction hump. This is quite significant, guestimated earlier that pattern control extends roughly half octave lower than the object size would make alone.It's interesting how even a small diffraction at the outer edge narrows the directivity for the lower frequencies.
Perhaps it's not that mystical after all - it seems to increase the apparent overall size of the source where the wavelengths are long enough.
So this is my take away - if you want as wide directivity as possible, eliminate all the diffraction. If you want to narrow the beamwidth, use it wisely 🙂
Anyway, maiky comparison graphs make quite easy to see how amount of sound to the edge affects interference in listening window. As the two profiles in this comparison (from maikys post above) differ mainly on the mouth and backside the difference on graphs is in low frequencies. This is due to less and less output to 90deg and beyond the higher the frequency which means interference in listening window gets smaller. If throat differed between these samples, or if it was wider coverage system on top, then there would be more difference on high frequencies as well. Basic interference stuff, no mystic 🙂

I encourage everyone to play with two ideal point sources and some filters in VituixCAD, to get intuition for interference on graphs, helps imagination.


Last edited:
No, the smoother one is wider. At least that is what the individual reports show and I believe it's swapped in the comparison graph.But, the comparison graphs seem to indicate response is narrower with the optimized profile though, if I interpret it correctly.
Last edited:
- Home
- Loudspeakers
- Multi-Way
- Acoustic Horn Design – The Easy Way (Ath4)