Hello All,
My first post in this (or a) forum") ...
...
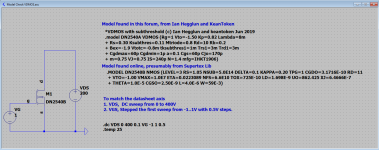
I'm working on a circuit where I discovered that the behavior in spice simulations is quite different from what I find in reality. Of course, this is no news to most here...
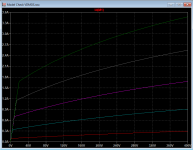
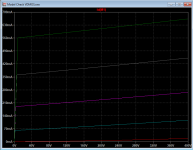
But my question is, maybe I'm missing something in the LTspice settings since my results are not even close to the diagrams I'm getting with LTspice?
Attached are the screenshots and .asc file used to give the overview.
I'm hoping somebody will share some insight here,
Best regards, Rens.
My first post in this (or a) forum
...I'm working on a circuit where I discovered that the behavior in spice simulations is quite different from what I find in reality. Of course, this is no news to most here...
But my question is, maybe I'm missing something in the LTspice settings since my results are not even close to the diagrams I'm getting with LTspice?
Attached are the screenshots and .asc file used to give the overview.
I'm hoping somebody will share some insight here,
Best regards, Rens.
Attachments
Hello Jan, Hi Ed,
Thanks for your help. I’ll give that a try.
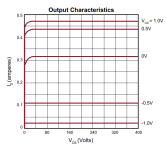
Ed, you’re right, however the used Vds and Vgs are exactly the same as in the datasheet, so I expected to get a simular diagram as per datasheet as a starting point.
@keantoken ; Would you be so kind and try shed some light on this subject?
BR. Rens.
Thanks for your help. I’ll give that a try.
Ed, you’re right, however the used Vds and Vgs are exactly the same as in the datasheet, so I expected to get a simular diagram as per datasheet as a starting point.
@keantoken ; Would you be so kind and try shed some light on this subject?
BR. Rens.
Last edited:
Yes, the @ flag sends an alert to said member.
Just like this @jan.didden
Just like this @jan.didden
Almost there, it's an automated process.I’ll await the moderators confirmation of me being a human
Didn't know trhat! Another learning day ;-)Yes, the @ flag sends an alert to said member.
Just like this @jan.didden
Jan
- Home
- Design & Build
- Software Tools
- Comparing model with datasheets