I should have also noted that you can perform arithmetic calculations on parameterized values. In the example circuit above, if you always want R2 to be twice the value of R1 (which itself has the value R), then you can show the value of R2 as {R*2}. This can come in handy in certain types of filter circuits where there is a fixed relationship between components in the filter.
👍I should have also noted that you can perform arithmetic calculations on parameterized values. In the example circuit above, if you always want R2 to be twice the value of R1 (which itself has the value R), then you can show the value of R2 as {R*2}. This can come in handy in certain types of filter circuits where there is a fixed relationship between components in the filter.
Hi All
I have downloaded a folder where there are blocks,, like gain block for use in feedback tests.
However who do I put in inverted output or not? and delay? I now how to use gain with K.
thanks.
I have downloaded a folder where there are blocks,, like gain block for use in feedback tests.
However who do I put in inverted output or not? and delay? I now how to use gain with K.
thanks.
Hi All
I have downloaded a folder where there are blocks,, like gain block for use in feedback tests.
However how do I put in inverted output or not? and delay? I now how to use gain with K.
thanks.
Attachments

I am trying to recall what I should do to get a proper FFT for the amplifier I built about two years ago. The FFT dialog has the number 262144 which I remember should be used to adjust the times properly. I devided the simulated time interval by this number to get the right time increment so that the entire analyses would have 262144 steps, but the FFT diagram looks too slim. Usually, as the frequency goes into the treble range, the diagram becomes fluffy, mine is not.
What should I do to get a properly looking FFT?
What should I do to get a properly looking FFT?
Pictures would help "thin" & "fluffy" are not that easy to interpretI am trying to recall what I should do to get a proper FFT for the amplifier I built about two years ago. The FFT dialog has the number 262144 which I remember should be used to adjust the times properly. I devided the simulated time interval by this number to get the right time increment so that the entire analyses would have 262144 steps, but the FFT diagram looks too slim. Usually, as the frequency goes into the treble range, the diagram becomes fluffy, mine is not.
What should I do to get a properly looking FFT?
I found on the forum where it was suggested to use the "Kaiser-Bessel" windowing function.
I setup my FFT as such (mostly through experimentation and using other peoples setups and configurations):
plus on my schematic the following parameters are set to:
.param Freq=20k (or any other frequency such as 1KHz)
.param numcyc=256
.param dlycyc=0
.param FFT=65536
.param simtime=(dlycyc+numcyc)/Freq
.param dlytime=dlycyc/Freq
.param numsampl=simtime/Freq/((simtime/numcyc)*FFT)
.param timestep 1m/8192
.tran 0 {simtime} {dlytime} {numsampl}
Here is the output:
1KHz - 1MHz @ 20KHz output, you can see the FFT starts rolling off at around 400KHz.

Here is the same configuration but for 1KHz, graph set to 100Hz - 40KHz:

Is the proper way of configuring a FFT output graph ?
I was hoping one day someone would explain in simple terms the mathematical relationships between all the FFT parameters.
I setup my FFT as such (mostly through experimentation and using other peoples setups and configurations):
- Number of data sample points = 131072
- Number of points = 31
- Windowing function = Kaiser-Bessel
- Kaiser-Bessel Parameter Beta = 101
plus on my schematic the following parameters are set to:
.param Freq=20k (or any other frequency such as 1KHz)
.param numcyc=256
.param dlycyc=0
.param FFT=65536
.param simtime=(dlycyc+numcyc)/Freq
.param dlytime=dlycyc/Freq
.param numsampl=simtime/Freq/((simtime/numcyc)*FFT)
.param timestep 1m/8192
.tran 0 {simtime} {dlytime} {numsampl}
Here is the output:
1KHz - 1MHz @ 20KHz output, you can see the FFT starts rolling off at around 400KHz.
Here is the same configuration but for 1KHz, graph set to 100Hz - 40KHz:
Is the proper way of configuring a FFT output graph ?
I was hoping one day someone would explain in simple terms the mathematical relationships between all the FFT parameters.
Last edited:
Code:
.param numsampl=simtime/Freq/((simtime/numcyc)*FFT)I'm the lucky owner of a brand new Win11 Dell PC with Alderlake processor.
However, when plotting graphs in LTSpice, I have a problem because the gridlines are missing, no matter what I try.
I also have a Win10 PC, with exactly the same LTSpice release and exactly the same installation settings.
But nevertheless, gridlines are absent in the new PC.
The PC is equiped with NVidia GTX1660 graphics and to exclude this board from the problem, I interchanged it temporarily for the GTX750 in my old computer that's having no issues.
So obviously it's not the graphics card but either the Intel Alderlake CPU, Windows 11 or the combination of both that's causing this strange problem.
Anyone else having the same trouble ?
Hans
That does sound odd. You mean Grid as in these? I'm running W11 but on unsupported hardware... and its been brilliant.
I know you are an experienced LT user Hans. Are the graphics clear and pin sharp like they should be? Can't think of anything really.

I know you are an experienced LT user Hans. Are the graphics clear and pin sharp like they should be? Can't think of anything really.
That does sound odd. You mean Grid as in these? I'm running W11 but on unsupported hardware... and its been brilliant.
I know you are an experienced LT user Hans. Are the graphics clear and pin sharp like they should be? Can't think of anything really.
View attachment 1010100
That’s the solution you gave, never to old to learn.That does sound odd. You mean Grid as in these? I'm running W11 but on unsupported hardware... and its been brilliant.
I know you are an experienced LT user Hans. Are the graphics clear and pin sharp like they should be? Can't think of anything really.
View attachment 1010100
Thanks a lot.
What amazes me most is that LTSpice on my new computer is 6 times faster, 4sec versus 25 sec for the same simulation !
Hans
Pleased to hear that's all it was Hans 🙂
Modern PC's can be blindingly quick compared to older ones and testing with LT simulations is something I've done. Its a great test and quite informative I think.
Enjoy your new PC.
Modern PC's can be blindingly quick compared to older ones and testing with LT simulations is something I've done. Its a great test and quite informative I think.
Enjoy your new PC.
A beginner question. I have a basic circuit drawn and want to run a dc simulation. I have followed posts #2 and 3 in this thread and got to the point where I get the operating point window up on the screen but I am unable to get to probe to hold over components to see voltages etc. The black window that displays the graph is not appearing either. Both of these will run on a more complex circuit which Calvin kindly sent me a while back so I know the program is OK but I want to learn how to get to that point myself. Any help much appreciated! Thanks in advance.
.OP analysis only presents a table of voltages and currents -- it's the Operating Point
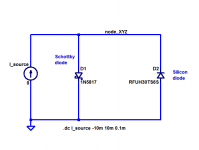
.DC analysis varies an independent source and presents a plot whose horizontal axis is (the independent source that was varied). I attach an example, in which an independent current source is varied from -10 mA to +10 mA. Simulation results show the difference between the Schottky diode and the Silicon PN junction diode.
.DC analysis varies an independent source and presents a plot whose horizontal axis is (the independent source that was varied). I attach an example, in which an independent current source is varied from -10 mA to +10 mA. Simulation results show the difference between the Schottky diode and the Silicon PN junction diode.
Attachments

Hello,
I'm fairly new to LTspice (and spice simulation in general), and I'm trying to load up and simulate a PSpice model of an LM3886,
I got the .lib file directly from TI's website (PSpice Model rev.B), I then imported the model by opening the .lib file and used "Create Symbol" feature, LTSpice created a model for me with all the correct pins and names.
When I initially tried to run it, I would get an error, the internal diode model had a typo:
.SUBCKT IDEAL_DIODE_0 A C
+PARAMS: EMCO = 0.01 BRKV = 60 IBRKV = 1M)
D1 A C IDIODE
.MODEL IDIODE D(N = {EMCO} BV = {BRKV} IBV = {IBRKV})
.ENDS
Removing ")" from the PARAMS line and saving the .lib file cured this issue,
I then created a number of simple circuits to try to confirm that the model is working fine, yet I keep getting error messages
Analysis: Time step too small; time = 1e-16, timestep=
1.25e-19: trouble with u1:d2:idiode-instance d:ut:d2:
the spice log is giving me lots of ERROR: Node U1:11 is floating and connected to current source......
I have also tried MicroCap12 simulator and also encountered similar problems, but I would really like to have a working LM3886 model in LTSpice.
I'm attaching a copy of the schematic and the lm3886.lib file if anyone would like to have a look themselves.
Thank you for your time!
H
Attachments
This is not a new problem. This model from Mark Whitney works well and includes a nice symbol.
https://www.diyaudio.com/community/...3886-lm3875-et-all.212805/page-3#post-4619153
https://www.diyaudio.com/community/...3886-lm3875-et-all.212805/page-3#post-4619153
Ok, some ~minor issues with Mark's model. The error log lists some "ERROR:.... floating NODE.." . I'm not sure I understand this completely, but it looks like these "ERRORs" are from these GRUn lines that define a G that has only 2 nets and the current is defined as the voltage/1e6 or some other value. How this is not a resistor, I dunno???? So, I replaced these lines with resistors and all the errors go away!!! and the results are exactly the same.
But, I did change the FFT operations so that the input =0%THD and the output is better than it was.
Oh BTW, LTSpice highlights extension lines in RED??? Is this an error? Do we need to concat these lines?
But, I did change the FFT operations so that the input =0%THD and the output is better than it was.
Oh BTW, LTSpice highlights extension lines in RED??? Is this an error? Do we need to concat these lines?
Attachments
- Home
- Design & Build
- Software Tools
- Installing and using LTspice IV (now including LTXVII), From beginner to advanced