RE: KT90EI
"When I rise the heater voltage on my spud amps, I observed the increase of sound warmth quality details and loudness."
Usually I hear about reducing the heater voltage to reduce distortion. The heater power has an effect on how large the electron cloud is around the cathode. A hotter heater would expand the cloud out closer to grid1. The largely 2nd harmonic rollover effect in triode curves comes from the grid1 wires being too close to the cathode, relative to the grid wire spacing. And the grid1 gm increases with closer spacing. So the higher heater voltage should be having a similar effect. Conclusion: more 2nd harmonic, warmer sound, louder.
Excellent!
When we apply more voltage to heater the tube can swing a little closer to 0V, but is a very small effect to be perceived as a loudness change (little max power dBW change, unless one are using a dud tube, I believe), and will occur only at "maximum volume", so the 2H change is the dominant effect.
If 2H changes and tube swings closer to 0V, the curves will probably bunches towards low currents and so is harder to turn-off the tube... hmmm.... yes, obvious but is time to see with my own eyes in tube-tracer") (if I not missed something)
(if I not missed something)
And other side-effect is to change the effective voltage where grid current starts, so for hi-µ tube fans is another effect to consider...
When we apply more voltage to heater the tube can swing a little closer to 0V, but is a very small effect to be perceived as a loudness change (little max power dBW change, unless one are using a dud tube, I believe), and will occur only at "maximum volume", so the 2H change is the dominant effect.
If 2H changes and tube swings closer to 0V, the curves will probably bunches towards low currents and so is harder to turn-off the tube... hmmm.... yes, obvious but is time to see with my own eyes in tube-tracer
(if I not missed something)And other side-effect is to change the effective voltage where grid current starts, so for hi-µ tube fans is another effect to consider...
Last edited:
I just tried varying the heater voltage on the 12GT5 (in triode mode) on the curve tracer, and I'll have to eat my words. Lower heater voltage made the curves rollover more and reduced gm. Higher heater voltage increased gm slightly. So much for the electron cloud theory.
I just tried a 12HL7 (high gm frame grid) in triode mode and got similar results. One new thing I notice is the triode curves developing hysteresis effects (higher plate current region) at lower heater V.
The 12HL7 pentode curves reduce gm significantly at lower heater V and show less (!) hysteresis effect in the knees.
Last edited:
Just tried the triode section of a 6LU8 to see if I get the same results versus heater voltage. And it is quite similar.
However, closer inspection of the curve variations reveals that the most negative grid V curve still increases in current with higher heater V and decreases in current with lower heater V (despite the curves getting more bunched there). So I think gm variation with Htr V is the predominant effect, but the tube Mu is also going lower (not surprising) with lower Htr V. (rather than some increase in difficulty to turn the tube off at high plate V).
Linearity of grid 1 versus electron cloud size must be a rather small effect compared to the gm variation effects.
Last edited:
6MJ6s I don't have. The RCA JEDEC datasheet for them says they are an ultra-reliable field replacement for 6LQ6 and 6JE6. (and 6ME6 ) Should be curves around for those. It also has almost identical specs to the 21/6LG6 (GE's version). Curves are around for that. 21LG6 and 6JE6/6LQ6 look identical on the curve tracer. A $4 replacement for 6LQ6.
Ah, to all McIntosh MC-3500/MI-350 owners out there: There's future for your gems
!Best regards!

+1Smoking-amp
you wonderful man...!!
I'm sure if Dr Gizmo were still around he'd give you this

I like all contributions from smoking-amp, including "crazy graphs" like crazy drive ans so and analysis about
Well, but now is time to me to publish some graphs and maybe I will be able to contribute a little at least to the forum
I've measured some tubes with low and high heater power, like 5.5V and 7V for 6.3V tubes
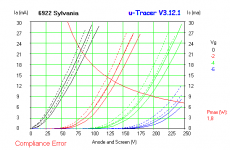
First, results from a mid-aged 6922
In this graph, the low and high heater results are superimposed, and the high heater are the most left coloured traces, eg.: for 0V is solid black for one unit, and dashed for another the "right" solid black are lor heater and the "left" solid black are high heater. Same for dashed and other colours.
I made for see if it alters matching and to appreciate differences resulting from similar but not exactly equal devices.
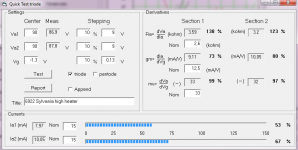
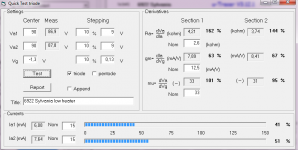
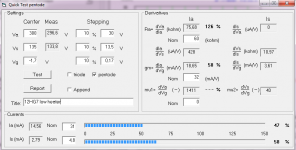
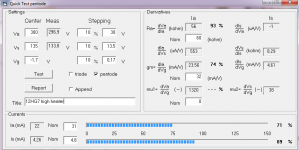
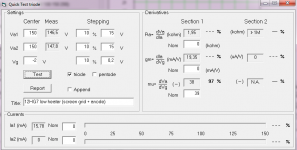
I've also included two quick testings, one for low heater and other for high heater.
I've measured some tubes with low and high heater power, like 5.5V and 7V for 6.3V tubes
First, results from a mid-aged 6922
In this graph, the low and high heater results are superimposed, and the high heater are the most left coloured traces, eg.: for 0V is solid black for one unit, and dashed for another the "right" solid black are lor heater and the "left" solid black are high heater. Same for dashed and other colours.
I made for see if it alters matching and to appreciate differences resulting from similar but not exactly equal devices.
I've also included two quick testings, one for low heater and other for high heater.
Attachments
OOps...
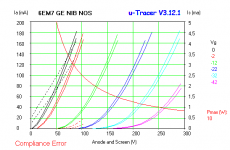
I included the graph for a 6EM7 and not for 6922. I include here the graph for 6922
By the way, the 6EM7 graph follow the same rules but since are dissimilar triodes, is more difficult to make, but at least is visible. The high-mu section is clearly the most affected. The low-mu section are barely affected by heater voltage
PS.: this is a Magnificent Television Tube, for spud and driver projects
Attachments
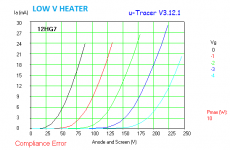
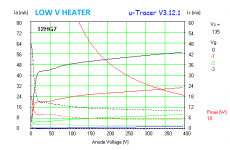
And now for a 12HG7/12GN7 (Westinghouse, used), a high-gm tube
Smoking-amp, about cut-off region, I not explored this but I under impression which this is exactly as you said, since the curves are not compressed diferently than usual, only changes a little the position of cut-off ...
Smoking-amp, about cut-off region, I not explored this but I under impression which this is exactly as you said, since the curves are not compressed diferently than usual, only changes a little the position of cut-off ...
Attachments
-
 12GN7 - QLH.png38.8 KB · Views: 86
 -
 12GN7 - QHHT.png34.8 KB · Views: 96
 -
 12GN7 - QHH.png33.5 KB · Views: 120
 -
 12GN7 - LHT.png9 KB · Views: 134
 -
 12GN7 - LHHT.png10.4 KB · Views: 510
 -
 12GN7 - LH.png10.7 KB · Views: 505
 -
 12GN7 - HHT.png8.9 KB · Views: 500
 -
 12GN7 - HH.png10.3 KB · Views: 499
 -
 12GN7 - QLHT.png37.9 KB · Views: 94
Last edited:
How current distributes between anode and g2 in triode mode?
A last one, resulting from some test connecting errors
But probably the only interesting ones...
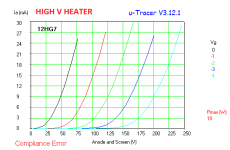
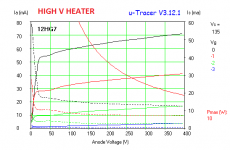
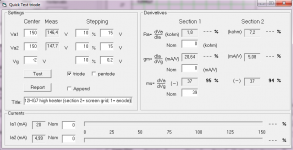
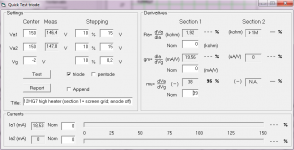
By "accident" I've measured the 12HG7 in triode mode with g2 and anode in different mesaurement probes in my tracer (like in pentode mode measurement)
The results are interesting. Some distribution of parameters exists, like current per electrode and gm and so on
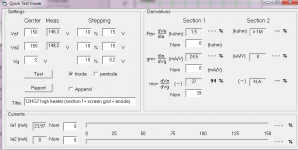
After that I connected the anode + g2 in unison, like the correct triode connection, and finally I connected only the g2 as a anode (this lower max pd but the µTracer measures with narrow/short pulses, so is OK). All resulted in some parameters differences.
Note when the anode are in one probe and g2 in another, the measured g2 gm are low, and the gm from anode are high. Also the rp from screen grid are HIGHER... strange, is the most close element to g1! And the measured current confirms the anode being the "section 1"
Only µ (mu) is the same...
A last one, resulting from some test connecting errors
But probably the only interesting ones...
By "accident" I've measured the 12HG7 in triode mode with g2 and anode in different mesaurement probes in my tracer (like in pentode mode measurement)
The results are interesting. Some distribution of parameters exists, like current per electrode and gm and so on
After that I connected the anode + g2 in unison, like the correct triode connection, and finally I connected only the g2 as a anode (this lower max pd but the µTracer measures with narrow/short pulses, so is OK). All resulted in some parameters differences.
Note when the anode are in one probe and g2 in another, the measured g2 gm are low, and the gm from anode are high. Also the rp from screen grid are HIGHER... strange, is the most close element to g1! And the measured current confirms the anode being the "section 1"
Only µ (mu) is the same...
Attachments
Last edited:
Very interesting DIYBras (the heater variations). Looks like what I was seeing. Nice to see super-imposed graphs.
Can you re-scale the triode plate current curves for the high heater V by maybe 0.8 or so, and overlay on the non-changed low heater V plate curves? I'm wondering if the one curve set can be transformed into the other set by a simple magnitude re-scaling.
----
With the separate probes on g2 and plate, how do you get triode characteristics? Not sure what is going on there. Are the g2 and plate connected together?
Last edited:
Good idea!
But unfortunately the µTracer produces too much graph artifacts when I try to change the scale when I keep the last plot (superimposed grid, curves and text labels).
But probably I must try to keep plot but without any grid/scale/texts so maybe turns possible to change the graph scaling ...
...
But unfortunately the µTracer produces too much graph artifacts when I try to change the scale when I keep the last plot (superimposed grid, curves and text labels).
But probably I must try to keep plot but without any grid/scale/texts so maybe turns possible to change the graph scaling
...With "strange" triode measurement (only when measuring the "quick mode") I set the tracer for measuring double triodes (one with each "high voltage" probe), and apply one probe to anode and other to g2. Maybe is interesting to graph this...
With normal triode-connected pentodes measurement it uses only one proble attached to anode+g2
Maybe this is a measurement/hardware artifact, but the current distribution makes some sense, so I start thinking about

With normal triode-connected pentodes measurement it uses only one proble attached to anode+g2
Maybe this is a measurement/hardware artifact, but the current distribution makes some sense, so I start thinking about
Last edited:
6MJ6 tubes look to be even less abundant than 6LQ6 tubes.
The 21LG6 ($4) tube is 12 pin versus 9 pin for the 6LQ6/6JE6 tube. Eight sockets to change!! I think I would try a 9 pin 36MC6 first. (same 9QL base)
Although there aren't curves that we could compare exactly, I'd bet that the big fat Russian 6P45S also will be a good replacement, as are 6KG6s/EL519s. But we'd also have to change sockets, 'cause these requires Magnoval ones.
Best regards!
Oops, for completion/clarifying: the superimposed triode measurement for 12HG7 figure has a LOW V HEATER written in it, but is low and high at same time, like the 6922 and 6EM7 casesAnd now for a 12HG7/12GN7 (Westinghouse, used), a high-gm tube......
Later when at home I will make the scale graph test
Maybe 180V g2 from original MC-3500 is not sooo high/hot so is possible to apply some different tubes, observing bias.Although there aren't curves that we could compare exactly, I'd bet that the big fat Russian 6P45S also will be a good replacement, as are 6KG6s/EL519s. But we'd also have to change sockets, 'cause these requires Magnoval ones.
Best regards!
Contrast to some others makers UC (Unity Coupling) like EAR509 with almost 300V (at least 250V) on g2. This is a way to make firecrackers


So if xL509 survives some time in amps like that, so the life in MC-3500 probably will be longer and usable
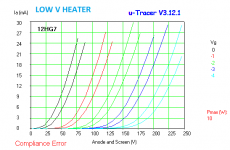
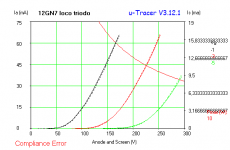
The triode-connected pentode: anode to g2 current distrinution...
Now, the graph for the tracer with a triode-connected pentode with the anode probe and g2 probe separated, to measure current distribution between anode and screen grid when triode-connected (to re-phrase my explanation)
Interesting to see. With proper graph scaling** is possible to put the screen trace over the anode trace
**in this case is easy to modify the scale, since the graph is the same. Make sure to read next post >
Attachments
- Home
- Amplifiers
- Tubes / Valves
- Those Magnificent Television Tubes