A lot happens in the vertical which often kind of ends up being the arbiter of the power response through the cross.so please take good polar measurements in both planes.
Four planes is arguably better, especially when square/rectangular waveguides or baffles are used.
The box is immutable, however yes, sealing the box and raising the mid to bass crossover as high as possible is also planned. Going to wait until I have the cabinets so I can do off-axis measurements.There seems to be a resonance around 500Hz on the mid response. Or, could be from your data splicing as well if you did near+ far field measurements and merged them. A resonance would need to be fixed by modifying the box, or if it's data processing error then would yield erroneous FIR filter so if you do FIR filters you must have very good data so it doesn't "fix" issues that actually do not exist, iow create actual problems out of bad data.
If I read properly you have ported mid, I suggest make the mid sealed and move up bass / mid xo as high as reasonable.
@Juhazi Thanks for the tips!! I am kind of a measurement pirate, and go freely between close and far field measurements and sims. I plan on doing close mic measurements for the drivers, put them into VituixCAD, simulate the crossovers and then set the levels and delay based on far field. I am very limited in space and have no ground plane available. Also it's all physically very exhausting so I do what I can do. I can definitely alter my plans to use 2nd order filters there.
Ty for the explanation on group delay. I actually kind of get that. What I am missing is the difference in what Vituix calls Excess vs. Normal. Like, how is it judging what's Excess? Isn't it all excess? 🙂
Team,
I really really want you all to know how much I appreciate you jumping in here. I hope I don't disappoint you in how limited my capabilities are to execute on some of the measurement techniques and speaker analysis you are all suggesting. I do appreciate the help and support and knowledge and at the same time lament my inability to act on all of it.
Please bear with me as I hobble along.
Thank you,
Erik
https://en.wikipedia.org/wiki/Group_delay_and_phase_delay
https://www.bksv.com/media/doc/17-198.pdf
I am not sure, but excess GD in a loudspeaker is caused by eg. non-optimal xo or driver unit physical pathlength mismatch - sort of difference between old-school electric xo design vs. acoustical measured outcome
Measured acoustical GD - theoretical predicted GD = Excess GD (can be positive or negative)
Signal theory is the basis: https://www.radio-labs.com/DesignFile/DN004.pdf
Group Delay and Filter Loss We made the intuitive argument before that a filter had to keep a signal for a period of time, in order to decide how to process it. In the case of a digital filter, this storage is easily visualised as sample values in some registers. What about RF filters? They must delay the signal also, and the only way they can achieve this is to actually store the signal energy. This energy is stored in the reactive fields of inductors, capacitors, transmission lines and any other reactive element.It is in the process of storing this energy that a filter has excess loss. By excess loss we mean the additional attenuation a real filter exhibits when compared to the analysis of an ideal filter with lossless elements.
Last edited:
The word excess has a special technical meaning here, it doesn't mean more than necessary.
It means group delay which is the result of excess phase. Excess phase is phase which is not minimum-phase.
It means group delay which is the result of excess phase. Excess phase is phase which is not minimum-phase.
I don't really understand maths and signal theory let alone FFT... Not even linear/minimum/excess phase. But the Group Delay (GD) curve in eg. REW and phase rotation in spl curves/filters is somewhat OK.
One difficult thing for us beginner-diyers with supereasy multipurpose REW is that room effects pollute our measurements so badly. Both spl and phase/GD are really tricky to get right and read below 500Hz, but one can learn to guestimate the artefacts and look past them. But if this bad data is given to a simulation program, it does not correct them.
This is why I skip simulations and work with only REW and dsp-software. Some understanding and many iterations is of course needed to set all parameters right in minidsp/HFD
I had to do some thinking with excess group delay, it's relevant question why would one use that instead of normal group delay in VituixCAD?
Long story short it's the most relevant one.
Normal group delay is sum of minimum phase group delay and excess phase group delay. Minimum phase group delay is not shown separately in VituixCAD. A system whose frequency response is wide bandwidth and smooth if not flat, a sensible goal for any loudspeaker, the minimum phase group delay would be close to flat and tell nothing about the system inner workings.
However, excess group delay would show the crossovers and any issues, as said by others. When a system frequency response is ~flat normal group delay would be just the excess group delay because minimum group delay is flat. Thus all the relevant information is in excess group delay.
Few examples to demonstrate, if it helps thinking about it:
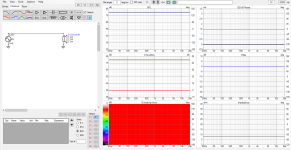
Ideal source, excess and minumum phase group delay are flat, normal group delay ends up flat:

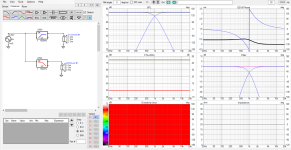
Ideal source again, but with a crossover. System frequency response is still flat so minimum phase group delay would be flat, which means normal group delay is just the excess group delay.

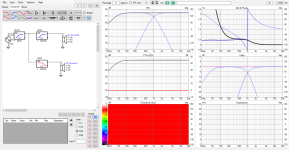
Introduce non-flat system frequency response by adding high pass filter, and minimum phase group delay starts to increase on low frequencies, thus normal group delay shoots up on the lows. Move the high pass bit higher and minimum group delay changes with the response, but excess group delay stays the same! excess group elay is due to the crossover and not due to the system frequency response!


The minimum phase group delay can already be anticipated being not flat just looking at system frequency response, so it's much more easier to see and understand the system frequency response than try and figure that out from normal group delay plot.
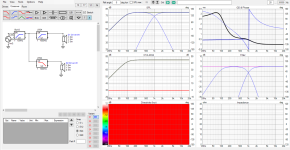
But, in addition the excess group delay tells a story, here it's crossover around 1kHz with particular slopes adding this particular excess group delay to the system. Hence this is new information to what the system frequency response already tells about.
ps.
if one has now a question what is minimum phase group delay? It is simply this: take frequency response, calculate minimum phase from that, and group delay from that. A frequency response of typical loudspeaker is close to this, but not exactly, there often is some secondary sound coming later than direct sound, which affects the frequency response.
Long story short it's the most relevant one.
Normal group delay is sum of minimum phase group delay and excess phase group delay. Minimum phase group delay is not shown separately in VituixCAD. A system whose frequency response is wide bandwidth and smooth if not flat, a sensible goal for any loudspeaker, the minimum phase group delay would be close to flat and tell nothing about the system inner workings.
However, excess group delay would show the crossovers and any issues, as said by others. When a system frequency response is ~flat normal group delay would be just the excess group delay because minimum group delay is flat. Thus all the relevant information is in excess group delay.
Few examples to demonstrate, if it helps thinking about it:
Ideal source, excess and minumum phase group delay are flat, normal group delay ends up flat:

Ideal source again, but with a crossover. System frequency response is still flat so minimum phase group delay would be flat, which means normal group delay is just the excess group delay.

Introduce non-flat system frequency response by adding high pass filter, and minimum phase group delay starts to increase on low frequencies, thus normal group delay shoots up on the lows. Move the high pass bit higher and minimum group delay changes with the response, but excess group delay stays the same! excess group elay is due to the crossover and not due to the system frequency response!


The minimum phase group delay can already be anticipated being not flat just looking at system frequency response, so it's much more easier to see and understand the system frequency response than try and figure that out from normal group delay plot.
But, in addition the excess group delay tells a story, here it's crossover around 1kHz with particular slopes adding this particular excess group delay to the system. Hence this is new information to what the system frequency response already tells about.
ps.
if one has now a question what is minimum phase group delay? It is simply this: take frequency response, calculate minimum phase from that, and group delay from that. A frequency response of typical loudspeaker is close to this, but not exactly, there often is some secondary sound coming later than direct sound, which affects the frequency response.
Last edited:
Eww, edit time over 😀 Here is revisit to the post script
ps.
if one has now a question what is minimum phase group delay? It is simply this: take frequency response data, ignore all measured phase data and calculate phase from the frequency response instead. Minimum phase is kind of the ideal phase. And minimum phase group delay is simply calculated from that. Phase info and frequency response are the same thing, just from different perspective, and can be derived from each other in this minimum phase sense. However, often there is something that makes measured phase differ from ideal or minimum phase even though frequency response could be the same, for example some secondary sound or phase rotation introduced by filters. This is excess phase, difference between measured phase and minimum phase. One could think the excess group delay shows how much the system differs from ideal.
pps. This group delay thing has been a bit of a grey area to me as well, I kind of understood what it is but not quite because I could not explain question "why would one look at excess group delay and not normal group delay?" right away. This led to thinking process whose results I tried above. So, thanks asking it, this kind of threads are good learning process in many ways for many people I think 🙂
Last edited:
Not exactly, it's quite a bigger topic than that.if one has now a question what is minimum phase group delay? It is simply this: take frequency response data, ignore all measured phase data and calculate phase from the frequency response instead. Minimum phase is kind of the ideal phase. And minimum phase group delay is simply calculated from that. Phase info and frequency response are the same thing, just from different perspective, and can be derived from each other in this minimum phase sense. However, often there is something that makes measured phase differ from ideal or minimum phase even though frequency response could be the same, for example some secondary sound or phase rotation introduced by filters. This is excess phase, difference between measured phase and minimum phase. One could think the excess group delay shows how much the system differs from ideal.
Hi, yeah like most things I tried to explain the fundamentals as simply as possible for this particular context. If there is an error I'd be glad if you point it out. If it's correct you could expand on it
It's like I say when people talk about extracting minimum phase from a response plot. It can't be done that way.
Perhaps it's time to tuck into some engineering textbooks.
Perhaps it's time to tuck into some engineering textbooks.
Hi, yeah like most things I tried to explain the fundamentals as simply as possible for this particular context. If there is an error I'd be glad if you point it out. If it's correct you could expand on it
Don't tire yourself with wrongly directed expectations.
I recently went to revisit my dream speaker's reviews. Of course, the Snell A/III. You don't have to like them, but I sure did. The part for me that was super important was remembering how good the speakers were before phase unrolling was a thing. Here's the two parts of the Stereophile measurements I want to equal. The first is horizontal dispersion. The second is the step response.
Peter achieves this using mostly 4th order filters but possibly a sixth order low pass in the bass (according to Troels here). I know there's the possibility of excess group delay in the bass section, but even so, if I can get anything near these results I'll be giddy with delight. I can always revisit this later if I have time and energy.
I'm not going to attempt a 6th order bass filter, BTW, I just wanted to point out how much he achieved with it.

Just posting this here so my initial project has achievable goals to meet before I start going crazy trying to equal the measurements of say the Grimm floor standers which I haven't even heard.
Peter achieves this using mostly 4th order filters but possibly a sixth order low pass in the bass (according to Troels here). I know there's the possibility of excess group delay in the bass section, but even so, if I can get anything near these results I'll be giddy with delight. I can always revisit this later if I have time and energy.
I'm not going to attempt a 6th order bass filter, BTW, I just wanted to point out how much he achieved with it.
Just posting this here so my initial project has achievable goals to meet before I start going crazy trying to equal the measurements of say the Grimm floor standers which I haven't even heard.
Attachments
Last edited:
- Home
- Loudspeakers
- Multi-Way
- Vituix and DSP - Converting my 2-way to 3


