Question on how to deal with phase.
I am measuring a 2 way with mic at 1m distance. I use REW with loopback so there is a fixed time reference. As expected, there are respective delays from the time reference to the impulse of each of the tweeter and woofer measurements.
I am able to extract the relative offset of the acoustic center from the impulse response. Which is good.
What I am not sure, is how to handle the phase. If I use the loopback reference, which is a few ms behind loopback ref (being 1m away), and the phase is screwed up as a result. I notice that the phase is very dependent on the timing reference, which is where I am confused.
Do I have REW derive the reference (from the start of the impulse?) Or do I use min-phase in Vituixcad when importing the frequency response. Which is the correct way to derive the phase?
Thanks.
Answer should be in measurement instructions. Search "2.907 ms" from the text. That is removing sound flying time of 1000 mm from all measurements of all drivers to include timing differences in exported phase responses. There is no such concept as "acoustic center". That is not usable/valid with 3D data.
Member
Joined 2003
Kimmo has provided a good response above. Removal of time of flight is not an absolute requirement, but helps for clear representation of driver phase. Setting reference time at the peak or start of the impulse is perfectly okay, just make sure that "left window" is used of about 1ms so all off-axis angles are captured within the window.
Keep in mind that determining acoustic distance by impulse peak is only accurate to +/- 1 sample time, which can be quite significant. At 96kHz, 1 sample represents 3.5mm of distance, or +/-18 deg phase shift at 5kHz. In any case, determination of relative offset is irrelevant with 2-channel loopback, just keep locked FFT window start reference and all delays will be inherently captured in the resulting FFT frequency/phase response with complete accuracy.I am able to extract the relative offset of the acoustic center from the impulse response. Which is good.
Preliminary version of measurement instructions for CLIO just uploaded to server.
This will be new master document including more generic and post-processing information than earlier versions for ARTA, REW and SoundEasy. So please read and give feedback no matter which program you're using.
This will be new master document including more generic and post-processing information than earlier versions for ARTA, REW and SoundEasy. So please read and give feedback no matter which program you're using.
Dear Kimmo,
I have a request for an upcoming update;
- could you please remove the '0' limit of the listening window angles?
reason for this is that I would like to have the possibility to optimize on of-axis angles (i.e. take -120 tot -180 as listening window to optimize a cardioid filter setting, this is currently not possible because the listening window can only go from -x to 0 or from 0 to x )
I am trying to optimize the filters of the loudspeaker as shown below:

2- would it be possible to have the DI curve as an optimization target? This would be very useful imo
Thanks in advance!
Kees
I have a request for an upcoming update;
- could you please remove the '0' limit of the listening window angles?
reason for this is that I would like to have the possibility to optimize on of-axis angles (i.e. take -120 tot -180 as listening window to optimize a cardioid filter setting, this is currently not possible because the listening window can only go from -x to 0 or from 0 to x )
I am trying to optimize the filters of the loudspeaker as shown below:
2- would it be possible to have the DI curve as an optimization target? This would be very useful imo
Thanks in advance!
Kees
Member
Joined 2003
1. I would simply go to driver's tab and adjust the angle values for your response. For example, if you want -120 to -180 deg, centre point is 150 deg, so 150 deg now = 0 deg, and adjust other angles accordingly.
2. DI curve is comparison of on-axis or listening window to power response, so it is optimized by proxy by optimizing your speaker by listening window and power response. Any optimization beyond that required greater change to the design than crossover part values.
2. DI curve is comparison of on-axis or listening window to power response, so it is optimized by proxy by optimizing your speaker by listening window and power response. Any optimization beyond that required greater change to the design than crossover part values.
Member
Joined 2003
A couple of short questions about the merger tool.
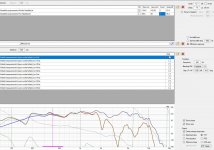
When I measured nearfield, I attenuated the volume by 20dB compared to the farfield measurements. So the scaling should be in the neighbourhood of this according to the tutorial. However my scaling is at 12dB, thats a big difference. What could be the cause for this?
What does the delay of -26mm refer to?
Attachments
Member
Joined 2003
Hi Lament, attenuation would not be only the 20dB attenuation used, but also the difference of SPL over distance from near field to far field. In the merger, you've set far field distance at 1m, is that correct?
Your screenshot is not showing only a -12dB attenuation. Based on the driver diameter entered it is showing -23.4dB adjustment of the nearfield response to compensate for SPL over distance, in addition to the -12dB overall attenuation.
Problem I see is that you've entered a count of 2 for near field response, and loaded both sets of measurements for each woofer. This would only be correct if you measured both woofers far field as a pair, in which case you would only have a single far field measurement set, not individual "upper" and "lower" measurements. Count of 2 for near field response will create 6dB reduction in the response scaling.
Change near field count to 1 and process the far field response for each driver individually. In any case, I don't put too much confidence in the automated math based on driver size and distance, use your eyes on the graph as the best guide.
Delay of -26mm is the delay required to align the phase of the near field measurement with the far field at your merge frequency. Best to not adjust this value, but for your education go ahead and adjust it and observe the change in phase response that it provides.
Yes 1m far field is correct.Hi Lament, attenuation would not be only the 20dB attenuation used, but also the difference of SPL over distance from near field to far field. In the merger, you've set far field distance at 1m, is that correct?
That makes perfect sense, the scaling to align LF and HF part is now at 18dB, much closer to 20dBYour screenshot is not showing only a -12dB attenuation. Based on the driver diameter entered it is showing -23.4dB adjustment of the nearfield response to compensate for SPL over distance, in addition to the -12dB overall attenuation.
Problem I see is that you've entered a count of 2 for near field response, and loaded both sets of measurements for each woofer. This would only be correct if you measured both woofers far field as a pair, in which case you would only have a single far field measurement set, not individual "upper" and "lower" measurements. Count of 2 for near field response will create 6dB reduction in the response scaling.
Change near field count to 1 and process the far field response for each driver individually. In any case, I don't put too much confidence in the automated math based on driver size and distance, use your eyes on the graph as the best guide.
")
So if I understand correctly, I keep the upper and lower woofer measurement sets (0-60 degrees horizontal for each). Click save, and a merged response file for each measurment is created. I then import these measurement sets for each woofer in the Drivers tab in addition to the tweeter far field measurement set. And if I remember correctly, set scaling to 2 for each of the zma files for the woofers.
Delay of -26mm is the delay required to align the phase of the near field measurement with the far field at your merge frequency. Best to not adjust this value, but for your education go ahead and adjust it and observe the change in phase response that it provides.
I understand, thanks Dcibel
Member
Joined 2003
The only caveat is that if you want to utilize power & DI charts to their full potential, 0-180 deg measurement set is required.So if I understand correctly, I keep the upper and lower woofer measurement sets (0-60 degrees horizontal for each). Click save, and a merged response file for each measurment is created. I then import these measurement sets for each woofer in the Drivers tab in addition to the tweeter far field measurement set. And if I remember correctly, set scaling to 2 for each of the zma files for the woofers.
Yes, scaling = 2 for impedance loaded that is measured as 2 drivers in parallel. Scaling = 0.5 for 2 drivers in series.
Questions keep coming as I work
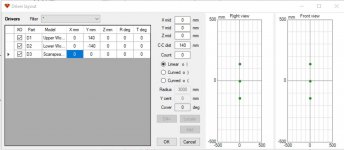
Driver layout in crossover.
MTM with tweeter offset 30mm, woofers 140mm above and below tweeter.
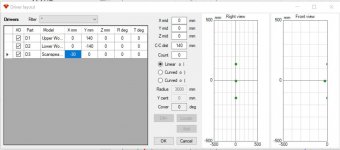
Layout 1 shows only vertical position of woofers relative to tweeter. On layout 2 I tried adjusting the 30mm horizontal offset for the tweeter. Instead of moving the tweeter 30mm to the left, the X'0' reference point is moved all the way to the right. So '0' is no longer in the centre of the baffle, like on the first image. What's up with that, is this a bug, or did I misunderstand something (I'm guessing the latter)?
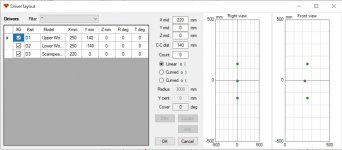
Layout 3 shows how it is supposed to look, adjusted for the new X coordinates.
Also don't understand why Z'0' is in the middle point of the speaker, and not on the front baffle (Z'500' on the Right view).
But Z is not supposed to be adjusted I guess, since this is incorporated in the semi-dual channel measurements?
Driver layout in crossover.
MTM with tweeter offset 30mm, woofers 140mm above and below tweeter.
Layout 1 shows only vertical position of woofers relative to tweeter. On layout 2 I tried adjusting the 30mm horizontal offset for the tweeter. Instead of moving the tweeter 30mm to the left, the X'0' reference point is moved all the way to the right. So '0' is no longer in the centre of the baffle, like on the first image. What's up with that, is this a bug, or did I misunderstand something (I'm guessing the latter)?
Layout 3 shows how it is supposed to look, adjusted for the new X coordinates.
Also don't understand why Z'0' is in the middle point of the speaker, and not on the front baffle (Z'500' on the Right view).
But Z is not supposed to be adjusted I guess, since this is incorporated in the semi-dual channel measurements?
Attachments
Last edited:
Member
Joined 2003
All 3 images are correct for the values entered, it is just axis scaling if you look at the x axis values at the bottom of the chart. I wouldn’t worry too much about it, based on your description the values in layout2 are correct. Alternatively you could enter x axis of 0 for the tweeter and offset the woofers to keep the tweeter as the design axis even though it’s offset on the baffle. At 2m+ listening distance it won’t make much difference.
z offset remains at zero for all drivers provided that :
-dual or semi-deal channel measurement was used
-the baffle is flat
-mic distance to baffle is unchanged for all measurements
-all measurements processed with the same window start reference time
z offset remains at zero for all drivers provided that :
-dual or semi-deal channel measurement was used
-the baffle is flat
-mic distance to baffle is unchanged for all measurements
-all measurements processed with the same window start reference time
Last edited:
DcibeL's answers probably cover these but in the other words:1 - could you please remove the '0' limit of the listening window angles?
2- would it be possible to have the DI curve as an optimization target? This would be very useful imo
1. Optimizing power average to some sector in rear (instead of listening window) without power response would not optimize directivity. It just searches the first local minimum to get that sector to target response with selected parameters to be optimized. It would probably ruin both on-axis and power response. Optimizing full power response and power average to limited sector in rear could also ruin on-axis without getting directivity to target.
So the only option to optimize polar pattern to omni, cardioid, super-cardioid, hyper-cardioid or dipole is to calculate measured/simulated polar pattern and penalty factor compared to target polar pattern designed/selected by user. That feature wouldn't be very difficult to add if target is simple textbook gradient with adjustable monopole part 0...100 %, and constant within frequency range of Power & DI target curve.
2. Optimizing directivity index is possible, but requires one more radio button for target response of Power & DI chart. Some weight for on-axis is also needed if parameters to be optimized affect on-axis response too. In that case optimizing on-axis and power response with 'Seek level' checked makes the same thing. This option would not optimize polar pattern so result could be anything within cardioid and dipole, just giving target DI.
All 3 images are correct for the values entered, it is just axis scaling if you look at the x axis values at the bottom of the chart. I wouldn’t worry too much about it, based on your description the values in layout2 are correct. Alternatively you could enter x axis of 0 for the tweeter and offset the woofers to keep the tweeter as the design axis even though it’s offset on the baffle. At 2m+ listening distance it won’t make much difference.
z offset remains at zero for all drivers provided that :
-dual or semi-deal channel measurement was used
-the baffle is flat
-mic distance to baffle is unchanged for all measurements
-all measurements processed with the same window start reference time
I just discovered that simulated frequency response differ slightly between layout 2 and layout 3.
The X offset and relative position between drivers is exactly the same on both layouts, so why the difference in frequency response I wonder?
Member
Joined 2003
Of course, I should have thought of that.Layout 3 moved your speaker off axis. Instead of the speaker pointed directly at the listener, it has moved 250mm to the side
But I would have preferred having the X 0 position in the middle of the front view, just seems more intuitive to me.
Thanks again Dcibel, I appreciate your assistance 🙂
- Home
- Design & Build
- Software Tools
- VituixCAD