And it was right under my nose... didn't see the option in Export - Filters Impulse Response as WAV.
Got it!
So, you're doing the left, then the right and finally merging them as a stereo file... couldn't we just do it from a stereo initial impulse? and use the stereo export checkbox?
Got it!
So, you're doing the left, then the right and finally merging them as a stereo file... couldn't we just do it from a stereo initial impulse? and use the stereo export checkbox?
After importing both left and right channel min phase impulse responses, I EQ each (one at a time) and then export the filter responses as a stereo wav. Let me know if there is a better way to do this.
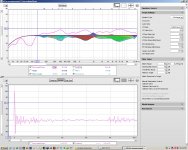
Attached is a screen shot of the EQ window after fixing my left speaker to show my settings and the resulting response. I'm making cuts only starting at about 64hz.
Attached is a screen shot of the EQ window after fixing my left speaker to show my settings and the resulting response. I'm making cuts only starting at about 64hz.
Attachments
To do it a bit faster, how about measuring left and right impulses, then averaging the freq, using REW to EQ the averaged window and then export as stereo?
Would not be as precise as doing each channel separately, but might speed up the process a bit.
I found that the max correction allowed in REW is 18db, since my dip at 90 is more than 18bd correction, it didn't attempt to fix anything there.
Anyway, That was just a test with an old impulse. I will need to redo my impulses with basic EQ applied first to bring everything closer to a manageable level for REW.
I think I'll be ok to do that on my own now! Thanks again for sharing your findings!
Last edited:
gmad,
Thanks for this REW guide and example, had used REW's EQ before for other small tricks but never would have thought of possibilities you lately shared. Also in the "All SPL" window and then "Controls" if one set right offsets between two curves there are six different way to add/extract/multiply/etc. to make new curves that could be exported as IR for whatever new task or exercise.
Perceval,
Regarding your dip at 90Hz is more than 18dB, then after the auto EQ run and before "Export" go manual into "EQ Filters" and set more filters manual, when doing that it seems range is up to +30dB and down to -99dB.
Perceval, one of the things you get when you do left and right separately is that you ensure your stereo sound at the listening spot is maximised. If you're looking for the answer why the under 300 does not get noticed by REW it is right there in front of you.
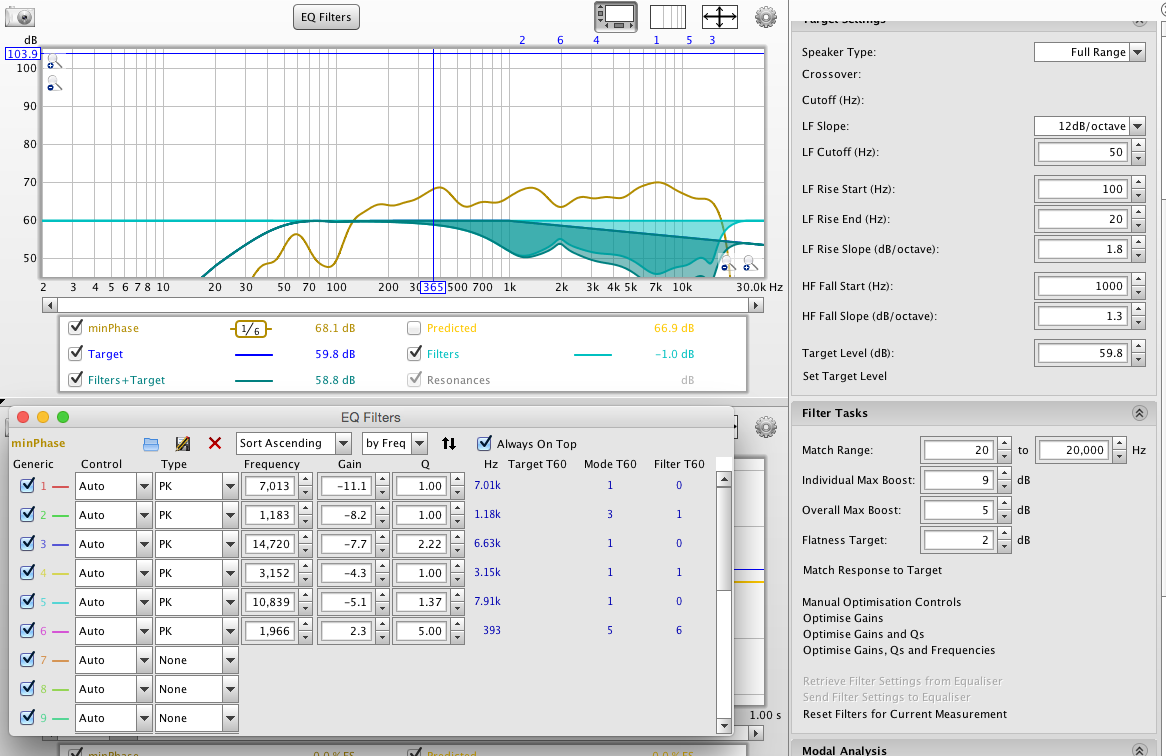
Look at the response, then look at the window that says: Individual max boost.
There's the answer. Individual max boost is set to 9 dB. That's pretty high already for a single driver. But your response at 90 Hz is down by 11/12 dB.
Overall max boost is set as 5 dB. So REW is doing what it is allowed to do.
One could argue it should have brought down the peak at ~370 Hz. But it may be too far of the target (9 dB). You can actually apply a manual setting, leaving it set to automatic and click the optimise gain an Qs to see what it is doing next. It is working within the limits set by yourself. Plus or minus 10 dB is a pretty big deal for a single full range driver.
Usually I leave the "Predicted" set to on to see what I'd get. Boosting 9 dB will be a big deal, but bringing down a peak should be possible.
But the power of this EQ-ing left and right separately is you gain a more stable stereo image. You would not get there by applying an average EQ of left and right. You could measure at a lot of different places for the left channel, average that and apply EQ based on the average. Repeat for the right channel. But that's a bit outside of the scope brought up here.
I see BYRTT has also posted about the dip and manual manipulation") .
.
Look at the response, then look at the window that says: Individual max boost.
There's the answer. Individual max boost is set to 9 dB. That's pretty high already for a single driver. But your response at 90 Hz is down by 11/12 dB.
Overall max boost is set as 5 dB. So REW is doing what it is allowed to do.
One could argue it should have brought down the peak at ~370 Hz. But it may be too far of the target (9 dB). You can actually apply a manual setting, leaving it set to automatic and click the optimise gain an Qs to see what it is doing next. It is working within the limits set by yourself. Plus or minus 10 dB is a pretty big deal for a single full range driver.
Usually I leave the "Predicted" set to on to see what I'd get. Boosting 9 dB will be a big deal, but bringing down a peak should be possible.
But the power of this EQ-ing left and right separately is you gain a more stable stereo image. You would not get there by applying an average EQ of left and right. You could measure at a lot of different places for the left channel, average that and apply EQ based on the average. Repeat for the right channel. But that's a bit outside of the scope brought up here.
I see BYRTT has also posted about the dip and manual manipulation
.
Last edited:
I'm a bit puzzled by perceval's screenshot. It seems to me like REW should be using more than 6 filters here. Since the freq response of the measurement is entirely below the target up to ~130hz, I wouldn't expect to see any correction performed on the 90hz dip regardless of max boost settings. What I would expect to see though is the cutting to start above 130hz rather than 300 hz. My first thought was that the "Generic" EQ possibly wasn't being used, but according to the filters window it looks like it is...
I'm still learning this software myself, so please correct me if I'm off the mark here. Perceval, if you want to send me the IR used in that shot, I wouldn't mind trying to figure this out..
I'm still learning this software myself, so please correct me if I'm off the mark here. Perceval, if you want to send me the IR used in that shot, I wouldn't mind trying to figure this out..
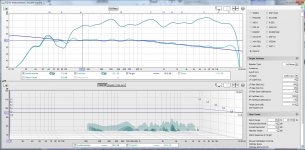
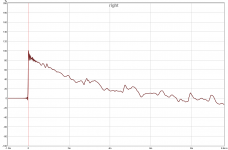
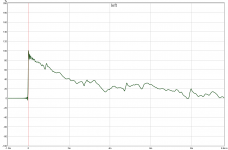
I ran a brief test with your impulse with the newest REW (5.14) and it did EQ down to 165 Hz. Is this a minimum phase exported impulse or the original measured one.
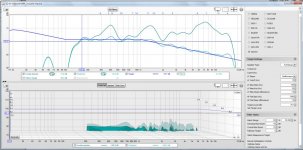
I just imported it in REW and ran EQ on a 1/6 oct frequency dependant window.

The target is random and the large boost numbers are meant for my arrays.
But it does as it's told basically.
Another try with a lower target and REW corrects down to 50 Hz with my bigger numbers in max boost allowed:

I just imported it in REW and ran EQ on a 1/6 oct frequency dependant window.
The target is random and the large boost numbers are meant for my arrays
.But it does as it's told basically.
Another try with a lower target and REW corrects down to 50 Hz with my bigger numbers in max boost allowed:
Attachments
Last edited:
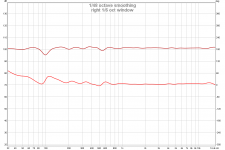
I was able to get decent results (see attached) with perceval's IR but not without engaging the Individual Max Boosts (I left Overall Max Boost at 0). It seems strange because with the individual max boost at 0, I got no correction below 300-400hz but with it cranked up there is no boosting being performed in that region anyway (just at a couple of treble freqs).
I get good (but slightly different) results with or without Individual Max Boost engaged with my own IR. Still more learning to do here...
BYRTT, thanks for that tip. I was able to do a pure inversion of my FR (like with DRC) using a Dirac spike and A/B in the "All SPL" window which was fun. I ran into a dead-end after that though but it's an interesting tool
Attachments
Perceval, be aware not to boost that single speaker (too much). Find out why you have that dip between 60 Hz and 130 Hz. There is something happening, that's for sure.
Greg, that predicted IR looks quite pretty. Not a bad way to go. Find out what's causing the big dip and hoping the other speaker clears up as nice and we are going places!
Greg, that predicted IR looks quite pretty. Not a bad way to go. Find out what's causing the big dip and hoping the other speaker clears up as nice and we are going places!
Happy New Year
I'm still very happy with the results I'm getting using REW for speaker/room correction. My preferred method right now is to apply only cuts (max boosts set to 0) to a 1/6 octave windowed listening position measurement (I got this to work with percevals's IR by dropping the target level). This makes avoiding dips easy while still getting a full range balanced response.
I recently got around to filling my speaker stands with sand, so I ran some new sweeps and did my thing with REW. I think this may subjectively be the best sound I have yet achieved considering both on and off axis response (and accomplished with about 9 PEQ's per channel). I have attached the predicted corrected response of just the min phase portion of my IR (the pre-echo is showing the effect of having upsampled the IR, although my usual highpass filter has not been applied here). It would be easy for me to make better looking graphs by using stronger filters, but I'm only interested in showing what makes me the happiest and that seems to be a minimalist (pun intended?) approach.
Attachments
Thanks. The dip must be a consequence of my untreated room because I saw no sign of it in my nearfield measurements. It's strange though because I just don't notice it with music (though it sure is ugly looking in the graphs). My (direct recorded) electric bass sounds pretty much spot-on despite having lots of energy in that area...
Is that dip slowly and gradually showing up? Meaning is it less deep at 1/3 FDW and 1/4 FDW smoothing? And even deeper later in time? And another question, is it still there in a 500 ms window?
I tend to look at it this way: if it's there from the start, it probably can be fixed with DSP (depending on how it looks at different angles/places in the room). If it's not there at an earlier time, meaning more flat, you've probably already heard the note. And you may be unable to fix it without doing more harm.
Pretty impressive either way.
I'd love to see a Wavelet spectrogram showing the first 25 to 30 ms. That will show it.
Another plot that would attract my attention would be a waterfall, with ~ these settings:

This is still the Dayton Audio RS100-4 right?
I tend to look at it this way: if it's there from the start, it probably can be fixed with DSP (depending on how it looks at different angles/places in the room). If it's not there at an earlier time, meaning more flat, you've probably already heard the note. And you may be unable to fix it without doing more harm.
Pretty impressive either way.
I'd love to see a Wavelet spectrogram showing the first 25 to 30 ms. That will show it.
Another plot that would attract my attention would be a waterfall, with ~ these settings:
This is still the Dayton Audio RS100-4 right?
Last edited:
gmad thanks wishes for your new year, wish same to you.
Looks nice data for listening position with minimalist approach thanks sharing recept.
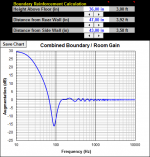
Seems your measured dip for L-R speakers is in area between 90-100Hz, with estimated speaker position height 36" above floor and 47" from rear wall and 43" from sidewall, plotting combined boundary and room gain in Spreadsheet by Jeff Bagby show dip around 90Hz as below.
Looks nice data for listening position with minimalist approach thanks sharing recept.
Seems your measured dip for L-R speakers is in area between 90-100Hz, with estimated speaker position height 36" above floor and 47" from rear wall and 43" from sidewall, plotting combined boundary and room gain in Spreadsheet by Jeff Bagby show dip around 90Hz as below.
Attachments
I'm still very happy with the results I'm getting using REW for speaker/room correction. My preferred method right now is to apply only cuts (max boosts set to 0) to a 1/6 octave windowed listening position measurement (I got this to work with percevals's IR by dropping the target level). This makes avoiding dips easy while still getting a full range balanced response.
Something looks suspicious to me. Can you share the raw 1/6th octave smoothed measurement? And then the subsequent correction? Or is that what you are showing in the graphs (I can't follow what you are showing in the FR graphs... also, what is 1/48th octave smoothed and what is 1/6th octave smoothed?)?
Thanks for the replies.
wesayso,
Yes, I'm still using the RS100-4.
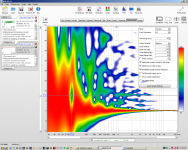
I tried the wavelet view and it is very interesting (this is a new one for me). As you can tell from my screenshot, I set the time range to 42ms (4 cycles at the dip frequency). The "hole" that opens and closes causing the dip doesn't look quite so bad from this perspective (although it starts forming right away) - maybe there is something to this?
As for the suggested waterfall settings - these wouldn't show anything below 333hz so I wasn't sure if that was correct...
BYRTT,
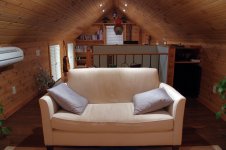
The drivers height is 28" and the front/side wall distance is 38". The room is 11' wide and I have attached a pic to show a partial wall behind the sofa which is 15' from the front wall (a little over 7' behind the listener's head).
ra7,
Sorry for any confusion. Ignore the 1/48 octave smoothing since I can't get REW to stop displaying that despite the checkbox settings in the image capture dialogue box (maybe a compatibility problem with XP?). It really shouldn't matter anyway since the (corrected) impulse response being shown has already been 1/6 octave windowed (not smoothed). I should have noted that freq and phase response are being shown simultaneously.
wesayso,
Yes, I'm still using the RS100-4.
I tried the wavelet view and it is very interesting (this is a new one for me). As you can tell from my screenshot, I set the time range to 42ms (4 cycles at the dip frequency). The "hole" that opens and closes causing the dip doesn't look quite so bad from this perspective (although it starts forming right away) - maybe there is something to this?
As for the suggested waterfall settings - these wouldn't show anything below 333hz so I wasn't sure if that was correct...
BYRTT,
The drivers height is 28" and the front/side wall distance is 38". The room is 11' wide and I have attached a pic to show a partial wall behind the sofa which is 15' from the front wall (a little over 7' behind the listener's head).
ra7,
Sorry for any confusion. Ignore the 1/48 octave smoothing since I can't get REW to stop displaying that despite the checkbox settings in the image capture dialogue box (maybe a compatibility problem with XP?). It really shouldn't matter anyway since the (corrected) impulse response being shown has already been 1/6 octave windowed (not smoothed). I should have noted that freq and phase response are being shown simultaneously.
Attachments
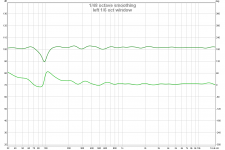
Sorry, that wavelet was showing the left speaker response. I'm attaching both channels here. The "hole" arrives a bit later and at a slightly higher pitch with the right speaker. I guess the two responses are "covering" each other a bit helping to hide the dips.
Attachments
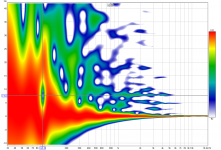
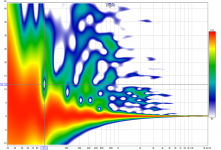
Sorry, that wavelet was showing the left speaker response. I'm attaching both channels here. The "hole" arrives a bit later and at a slightly higher pitch with the right speaker. I guess the two responses are "covering" each other a bit helping to hide the dips.
True, they do... I think it's the floor bounce. Trying to see how a stereo wavelet looks would be interesting to see that summing.
The other question had nothing to do with the dip. I was just curious how that waterfall looks on that particular driver after the minimum phase EQ.
- Home
- Loudspeakers
- Full Range
- A convolution based alternative to electrical loudspeaker correction networks