The rabbit was fed a steady diet of Apple earbuds after that...
...

...Thanks for sharing those curves. The attached graph is the JBL curve vs. my 2 ch avg room response with my psycho filter and the Katz 1kHz "knee" (1/24 oct fdw + psychoacoustic smoothing used for graph)...
Looks great and beautiful documented 🙂.
...Nice work on that headphone response. That's something I'd like to try as well with my HD580s. My understanding at this point is that the curve with the ~2.7kHz peak is more for earphones while a flatter response is more appropriate for headphones. Let me know if you have any thoughts about that.
My thoughts on that is really hope not have used it wrong way 😛 on innerfidelity.com under resources there is a part one and part two explanation touching HARMAN research curve, direct link is here Headphone Measurements Explained - Frequency Response Part One | InnerFidelity and here Headphone Measurements Explained - Frequency Response Part Two | InnerFidelity.
Also under resources you can find a measurement named "HD 580 (HD600 headband)" that you could try out how it sounds transfer it to HARMAN curve, on paper HD580 looks a lot like HD650 except above 10 kHz. Method myself used was in pdf document viewer maximize the top left plot to fill hole screen to capture it into MS paint where a new other colour trace than grey was drawn as average of the multiples of raw data (grey traces), thereafter used FPGraphTracer : fprawn labs to get cans average curve traced.
If you look at miniDSP site they announce a new unit to measure cans so maybe we in future can do it better and not just make predicted correction but a documented one.
Thanks again, BYRTT. That's a lot of new info for me; I'll be looking into it when I'm ready.
Virtual demo folder now contains an uncorrected room sample as a secondary reference (response shown in attached graph). The speaker's quasi anechoic freefield response is -6dB@80Hz (Qtc: 0.5) with a 1dB/decade "tilt". Even with a "nearfield" position, you can see the drastic effect the room acoustics have on the response. Although probably hard to believe after listening to the virtual demo, it actually sounds pretty good in reality and I have enjoyed it this way for many weeks. What I'm trying to show with this demo is how effective this automated correction method is despite its fairly low resolution (1-4 cycles) and very limited dip correction. The benefit of this should be less chance of response issues outside of the sweetspot even with single point measurements, along with possibly reduced cone excursion/increased efficiency of amplifier power.
Virtual demo folder now contains an uncorrected room sample as a secondary reference (response shown in attached graph). The speaker's quasi anechoic freefield response is -6dB@80Hz (Qtc: 0.5) with a 1dB/decade "tilt". Even with a "nearfield" position, you can see the drastic effect the room acoustics have on the response. Although probably hard to believe after listening to the virtual demo, it actually sounds pretty good in reality and I have enjoyed it this way for many weeks. What I'm trying to show with this demo is how effective this automated correction method is despite its fairly low resolution (1-4 cycles) and very limited dip correction. The benefit of this should be less chance of response issues outside of the sweetspot even with single point measurements, along with possibly reduced cone excursion/increased efficiency of amplifier power.
Attachments

Here's a target response I'm trying out right now (not for the first time though) which I think better matches the response of flat speakers measured at the listening position in my room. It's made by applying a downward tilt on a linear freq scale rather than the usual log scale. It seems to do a pretty good job of taking the "sizzle" out of pop/rock recordings that tends to be an issue with a flat listening position target, while not "suffocating" classical "field" type recordings. I'm using it in conjunction with my psycho filter right now. This can be done with DRC by using control points of 0 at DC and approximately -6.5 at 22050Hz, and one of the linear interpolation types, but I get a better response shape using Audacity - especially at a higher sample rate. Note that the Audacity EQ is linear phase (though I doubt it really matters for this filter).
On another note, DRC has been updated a few moths ago (thanks!). Doesn't seem like much of a change, but I'll try to update the package at some point in the future.
On another note, DRC has been updated a few moths ago (thanks!). Doesn't seem like much of a change, but I'll try to update the package at some point in the future.
Attachments


Last edited:
Of all the EQ targets I tried I always came back to the one that had a curve in the downwards tilt and not a straight line. I also preferred the one that rounded out the knees (400 and 200 Hz). Very little difference in measurements but they somehow sounded better. I also used linear interpolation to better match the target curve.
Different values to you but the curve is visible between 1K and 6K.
Different values to you but the curve is visible between 1K and 6K.
Attachments


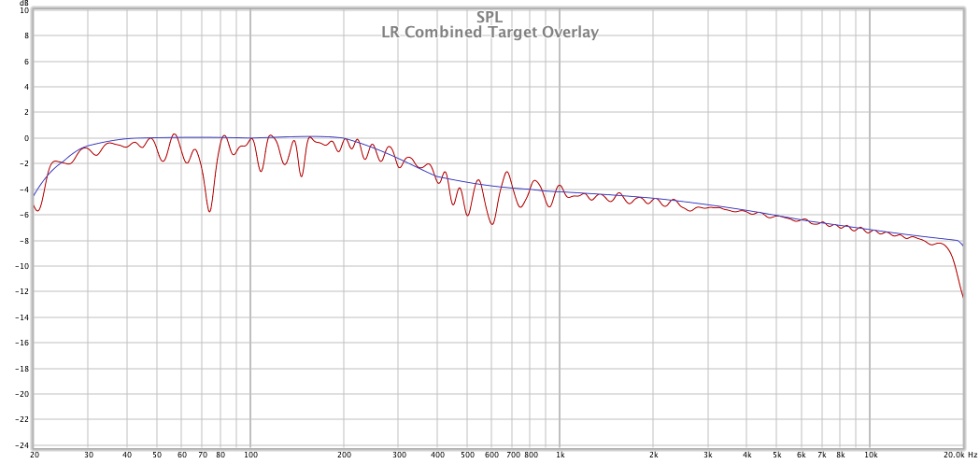
Created this out of curiosity - Fluid and JBL graph combined:

Mine looks like this:

What you see here in my graph is left + right channel, with a 20 cycle frequency dependent window smoothed 1/3, at the listening spot.
I do believe for tonal balance we need a longer window, but not a 500 ms window at all frequencies to determine it. The 20 cycle FDW smoothed 1/3 rd seems to work pretty good for me in my room.
Mine looks like this:
What you see here in my graph is left + right channel, with a 20 cycle frequency dependent window smoothed 1/3, at the listening spot.
I do believe for tonal balance we need a longer window, but not a 500 ms window at all frequencies to determine it. The 20 cycle FDW smoothed 1/3 rd seems to work pretty good for me in my room.
Attachments


Wow, that's an amazingly close match (2nd graph).
The bass shelf thing doesn't work for me though. Good thing too, because that would probably eat up a bit of my headroom...
The bass shelf thing doesn't work for me though. Good thing too, because that would probably eat up a bit of my headroom...
I got there by preference, EQ-ing over a long period way before I noticed the close resemblance. As said: it is a 20 cycle FDW view.
Now that I know I like that JBL curve, I even use it to quickly get it all into shape when starting over. The mid/side EQ still changes a few things, but it's all hinged around this curve. Meaning this is what I get to hear in the side panned material, as tonal balance.
I simply love that low end, down to those low numbers... As there is an absence of room modes acting up it isn't overpowering at all. As seen in the wavelet graphs.
Separately from me, Mitch (michba) has pretty much the same thing except for that bass shelf. I do believe JBL is on to something, but we have to check longer windows for tonal balance. That makes quite the difference. However a 500 ms window smoothed just does not represent how I hear things.
Left/right balance is also set using these longer 20 cycle FDW windows. It's not what I use for DRC, obviously, that still has ~4 cycles correction for much of the frequency band. But I see it as separate from tonal balance. As tonal balance can depend on what the room adds. With the damping panels it isn't much difference, that's why I started figuring out where the tonal balance was coming from, how long a window I needed for that. And it definitely is frequency dependent. I may change my opinion, as usual, for now this works remarkably well.
This is why I have a target in DRC-FIR that's pretty flat, and use post EQ to set my tonal preference. DRC is used to get that first wave front into shape. Normal PEQ is used to shape it to my room curve at a later stage. Got tired of changing the target file and re-running DRC-FIR as it really only should be about speaker correction. The post EQ is room and tonal balance. 2 separate things for me nowadays.
Last edited:
As we aren't measuring and smoothing in exactly the same way it makes it a little hard to compare preferred targets but there is a lot more that is similar in the graphs than wildly different.
I started with a 1db/oct tilt starting at 30Hz which worked very well and is more similar to wesayso's graph than what I ended up with.
I tried with a flat target for DRC and used PEQ to change the balance to what I wanted by ear. Turns out it came right back to the same sort of curve 🙂
I preferred it slightly to let DRC correct to my preferred curve. At that point I was struggling to make it better with PEQ corrections, all I got was different.
200 to 500Hz was quite messy in the room I took those measurements in which may account for a different preference in that area. They have a new home now so it will be interesting to see if I end up with a different target when I get time to set them up again.
For me the preference in shelving can change depending on the overall balance, if I tweak the mids and highs I need to adjust the lows to bring it all back.
It's a tall order asking your Hypercubes to go anywhere near as low as a line array, if I didn't have as much very low end I also would prefer less shelving boost
@wesayso:
Well, there must be something to it...that's quite a coincidence.
I would make my low end a little flatter/more extended, but my room booms a bit in the bottom octave and I'd rather not hear it. Easing up on the bottom end extension (PLStartFreq = 128) helps mask this and increases my headroom while still sounding good to me (I don't want to use a long window to tame it).
Still with you on the 4 cycles DRC window. Interesting that despite the differences between our systems, that seems to be a constant theme. As for channel balance, with the psycho filter (magnitude response envelope correction of the windowed impulse response), I found that simply matching the peak impulse level of the corrected L and R responses worked well enough.
Target response (other than flat) has always been separate for me (I'm running it in its own convolver instance) for the same reasons as you stated.
edit:
Thanks, fluid - all interesting points especially the first and last.
Last edited:
There's no right or wrong here... only preference 🙂
I do agree that we tend to over compensate for restless pieces of the FR graph. The 100-200 Hz area (right where the impedance peak is on the arrays) is tricky to get right. I had some phase deviations there for a long time and at that time I put in more energy there in the graphs to compensate. Once I got the phase just right, the slam from drums was there so I could ease off.
Getting the phase right took time. And lots of experiments.
In case anyone is interested in trying the linear tilt target, I've posted a text file for use with DRC. This file is made for one of the usual log interpolation types and has 10 control points (to define the curve on a log scale).
Also, I made a new virtual demo folder comparing a reference track to speaker only correction (flat response with 80Hz f3 Butterworth) and the psycho filter with the linear tilt target which is serving as a "room compensated" speaker correction filter.
I think the psycho filter in this case is at least as neutral as the speaker only correction, but with better balance (there is an upper-bass "suckout" in my room), more headroom, and *much* less work to create. Not bad considering there are no noticeable artifacts from any location. I think it's a win-win-win.
Quick note: I changed the psycho filter PLStartFreq to 128 to reflect my current settings and provide better compatibility with smaller speakers.
Package has been updated to run the latest version of DRC. I rewrote some portions of the guide for (hopefully) improved clarity. I'll make any customized files available separately (as of now, just the psycho folder which includes the linear tilt target). I also added some additional notes to post #1.
I updated the experimental psychoacoustic filter package. This version uses two scripts/configuration files and is an attempt to overcome some previous limitations while still remaining somewhat user-friendly.
The first script (prefilter.bat) removes excess phase, applies a 9 cycle (~1/12th oct) frequency dependent window, applies microphone compensation, and saves the responses as left/right raw files to be used by the second stage. Additionally, these prefiltered impulse responses are converted to a single stereo wav file and placed in the "Impulse Responses" folder for further evaluation.
The second script is used to create a correction filter based on the prefiltered responses. This is done by calculating the (inverted) spectral envelope of the prefiltered responses with 1/6th octave resolution, and applying independent target responses for both the high and low frequency ends of the spectrum.
Three user-specific edits should be made to the scripts. In the "prefilter-44.1" config file, MCPointsFile should be changed to the appropriate mic calibration file. In the "psychofilter.44.1" config file, MCPointsFile should be changed to the desired linear tilt (high freq) target file, and PSPointsFile should be changed to an appropriate high pass (low freq) target file. The chosen high frequency target response will depend on room acoustics, speaker distance, and personal taste, while the chosen low frequency target response will depend on speaker enclosure type (alignment), available headroom, and personal taste. The high pass filtering is linear phase, which helps to prevent excessive low frequency phase shift in the corrected response due to the compounding speaker/filter responses.
The linear tilt target files range from -5dB to -9dB at 22.05kHz, while the high pass target files have "cutoff frequencies" ranging from 16Hz to 64Hz in 1/3 octave increments. There are 2nd order and 4th order versions of each high pass target modeled after cascaded 1st order/Butterworth 2nd order filters for smooth response (-6dB cutoff).
Convolving the prefiltered impulse response with the filter will give a predicted corrected (windowed) response which can be used to aid in channel balancing.
Attached graphs show the prefiltered and corrected responses of my (4" single driver, filterless, sealed) speakers using "LinTilt3" (-7dB at 22.05kHz) and HP32-12 (2nd order high pass -6dB at 32Hz). Each speaker was measured from the listening position.
Attachments


Is that second graph from APL TDA?
I've had trouble running DRC on my computer lately.. don't know why. It's been coming up with botched convolved filters that sound low and boomy.
I've had trouble running DRC on my computer lately.. don't know why. It's been coming up with botched convolved filters that sound low and boomy.
I have no idea... even using DRCDesigner to do the sweeps, and using their regular presets, I get botched sounds.
Really weird. It's the same PC that used to work well before, I put it in storage for a few months, and when I take it out again, the steps I used for making filters do not work anymore.
Really weird. It's the same PC that used to work well before, I put it in storage for a few months, and when I take it out again, the steps I used for making filters do not work anymore.
If you're interested, I could try making the filter. If it works, at least we can rule out the measurement as the problem. And I can get some feedback on this latest scheme. 🙂
Thanks Greg.
Let me see where I saved my latest REW sweep.... I've been bad/lazy and my files are all over the place right now.
Let me see where I saved my latest REW sweep.... I've been bad/lazy and my files are all over the place right now.
- Home
- Loudspeakers
- Full Range
- A convolution based alternative to electrical loudspeaker correction networks