So, does anyone have a nice method to add an baffle to an ath produced waveguide and simulate it like that instead? It would be nice to compare the results")
You can see my efforts at this sort of thing here 2 way waveguide speaker build ABEC modelling
It is easy enough when you get the hang of it and have a base template in place but the learning curve is steep to start.
Depending on the size of the guide depends on how much symmetry is needed to make the solve time reasonable. I used 1/4 on the waveguide to simulate baffle width and diffraction, but 1/2 for the woofer in the full size cabinet.
Yeah, and this is not a particularly well terminated example (and still quite small).Got it! Makes sense why there appear to be some ripples/diffraction from the edge in that case. I've done similar simulations with circsym and a dome tweeter profile and they appear much smoother due to the infinite baffle.
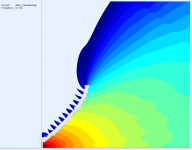
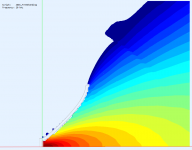
- Some pretty pictures (2 dB step)
Attachments
Last edited:
Linear frequency abscissa...
I think that for an axisymmetric waveguide development we can't wish more.

What are the dimensions?
You can see my efforts at this sort of thing here 2 way waveguide speaker build ABEC modelling
It is easy enough when you get the hang of it and have a base template in place but the learning curve is steep to start.
Depending on the size of the guide depends on how much symmetry is needed to make the solve time reasonable. I used 1/4 on the waveguide to simulate baffle width and diffraction, but 1/2 for the woofer in the full size cabinet.
Thanks I'll have a look.
Regarding the optimisation discussion, is it relevant to simulate the infinite baffle scenario when the application is in a baffled speaker? Or is it safe to say that the optimum solution in an infinite baffle also will be the optimum solution for a baffled case?
From my experience I think it is pretty safe to say that a waveguide that's good in IB remains good in an enclosure that is properly rounded. I can't really imagine optimizing a waveguide for a sub-optimal enclosure. The infinite baffle is definitely a good starting point. It's also faster to compute than a full enclosure model - this is not a small thing.
Great! I'd love to see a proper gated measurement that could be directly compared to the simulation. I know it is no small task, I still haven't measured my prototypes.
Outdoors a la ... ??
Gainphile: R16 - Constant Directivity Loudspeakers
Gainphile: R16 - Constant Directivity Loudspeakers
Last edited:
Like this? Wait for the next release...
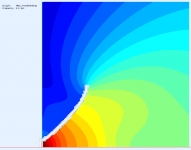
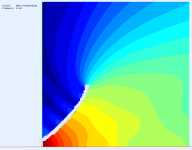
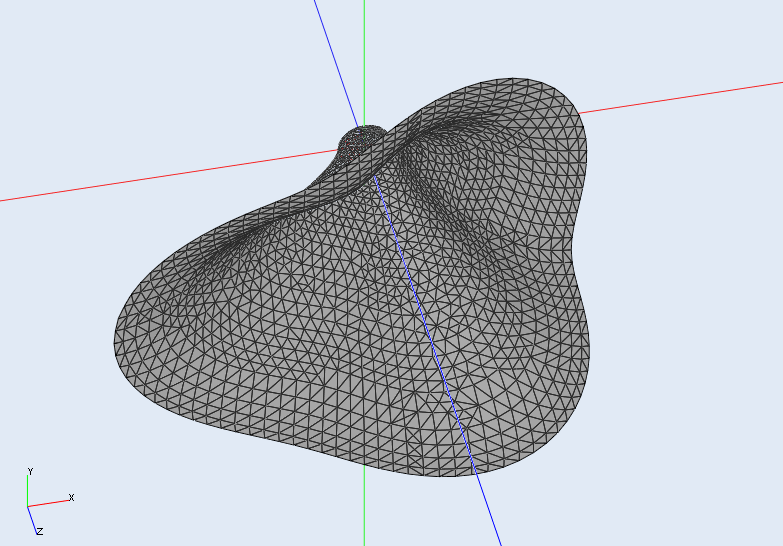
There will be four options, finally (no matter what the underlying shape is):
a) quadrant 1 only (currently the only possible)
b) quadrants 1+2
c) quadrants 1+4
d) all four/no symmetry
Quadrant (Wikipedia)
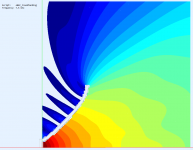
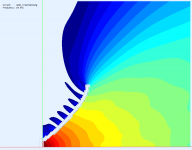
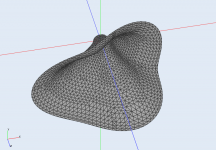
There will be four options, finally (no matter what the underlying shape is):
a) quadrant 1 only (currently the only possible)
b) quadrants 1+2
c) quadrants 1+4
d) all four/no symmetry
Quadrant (Wikipedia)
Attachments
Last edited:
Not necessarily outdoors but with at least 4 - 5 miliseconds of reflection-free time when measured from at least 1 m, preferably more. Also not necessarily every 5 deg, 10 would be fine.
https://www.diyaudio.com/forums/multi-way/360973-hf10ak-12p80nd-custom-wg-4.html#post6362957
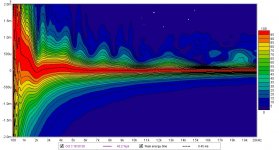
Best I can do for now. Will have another go next weekend.
You go in the good direction. What you want is to eliminate all reflections from the picture. This is done by applying a time window to the measured impulse response and calculating frequency response from that. I don't use REW but I know it is possible there. Try to trace the first reflection that arrives to the microphone after the direct sound. The aim is to get this time gap as long as possible by placing the speaker AND the microphone far from any boundaries. You'll quickly learn this.
BTW, even from the current pucture it is obvious that the waveguide is virtually perfect. Congratulations
BTW, even from the current pucture it is obvious that the waveguide is virtually perfect. Congratulations
Last edited:
Do you know if there is an idiots guide to understanding what is the expectation in a wavelet spectrogram.
1/12th resolution
6ms before peak
10ms after peak
Or what ranges to use on the chart in order to see what needs to be seen? ;-)
1/12th resolution
6ms before peak
10ms after peak
Or what ranges to use on the chart in order to see what needs to be seen? ;-)
Attachments
Last edited:
- Home
- Loudspeakers
- Multi-Way
- Acoustic Horn Design – The Easy Way (Ath4)