Thanks guys. I'll definitely check out Tina. In the mean time I downloaded and installed a similar circuit analysis program from Analog Devices, which was about a gig by the time I had the update (very large program). It allows up to 50 devices. I've modeled my circuit and just need to figure out how to run it. I may need to actually hook up power supplies (which may have been the problem with LTSPICE). AD is an excellent company, so I have high hopes. I should have results soon.
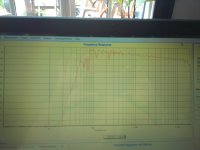
Well, tina is in and worked on just the front end, but now after adding the rest of the circuitry it keeps showing the graph for just the front end, and the dB scale is way off. It's as if the whole low end EQ circuit is just a big resistor...(?)
Selecting an output leaves me very confused. There's a "voltage pin" symbol that must be selected and placed, and then there's the "insert output" command that puts up something that needs to connect across something - not sure what (?) The HELP menu didn't get me there.
Selecting an output leaves me very confused. There's a "voltage pin" symbol that must be selected and placed, and then there's the "insert output" command that puts up something that needs to connect across something - not sure what (?) The HELP menu didn't get me there.
Attachments
I am still playing with Tina and am a total newbie at it so still trying to figure out why stage 1 works but stage 1 does not even produce the right shape. I have to say Tina is on general pretty easy to figure out as I have not had to look at a manual yet. I hear it will also work as a virtual instrument (o scope spectrum analyzer etc) if you have a DAQ.
Bob
I have plotted your circuit in Tina.
Haven´t got opa 2134 so I used lm318.
It oscillates at a very low ferq. with C8 at 100n but with 1u it simulates fine.
Try to put a meter at the output and use the oscilloscope to see what happens.
The probe (voltage pin) you do not need.
I have plotted your circuit in Tina.
Haven´t got opa 2134 so I used lm318.
It oscillates at a very low ferq. with C8 at 100n but with 1u it simulates fine.
Try to put a meter at the output and use the oscilloscope to see what happens.
The probe (voltage pin) you do not need.
This circuit is compensating the IDS25 way too much IMHO.
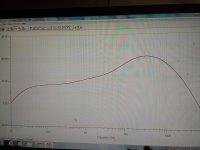
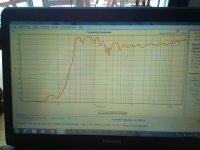
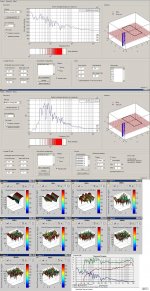
Here is a plot of one (not the final) correction filters generated by Audiolense.
It is with room correction and with a B&K target file.
It is also set to a max compensation of +12dB, wich is a good idea still IMHO.
Pic 1 is correction filter
Pic 2 the simulated response in room after correction.
Here is a plot of one (not the final) correction filters generated by Audiolense.
It is with room correction and with a B&K target file.
It is also set to a max compensation of +12dB, wich is a good idea still IMHO.
Pic 1 is correction filter
Pic 2 the simulated response in room after correction.
Attachments
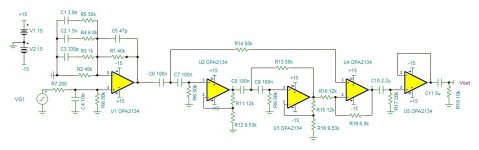
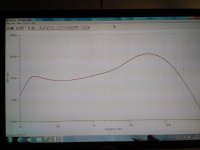
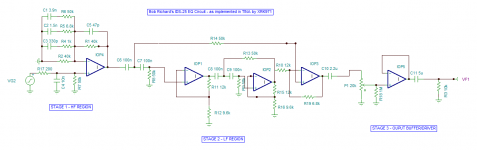
Bob's IDS25 Circuit in TINA
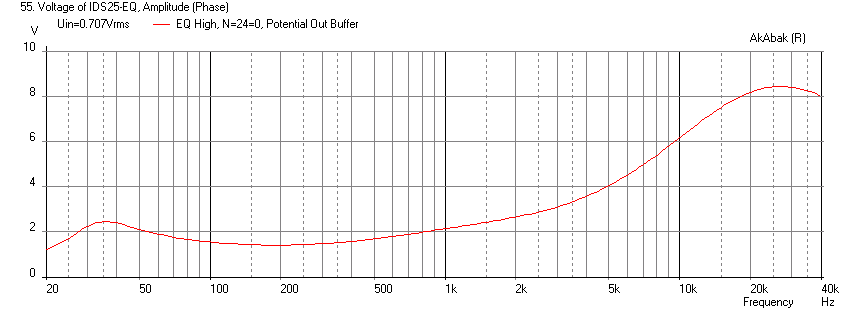
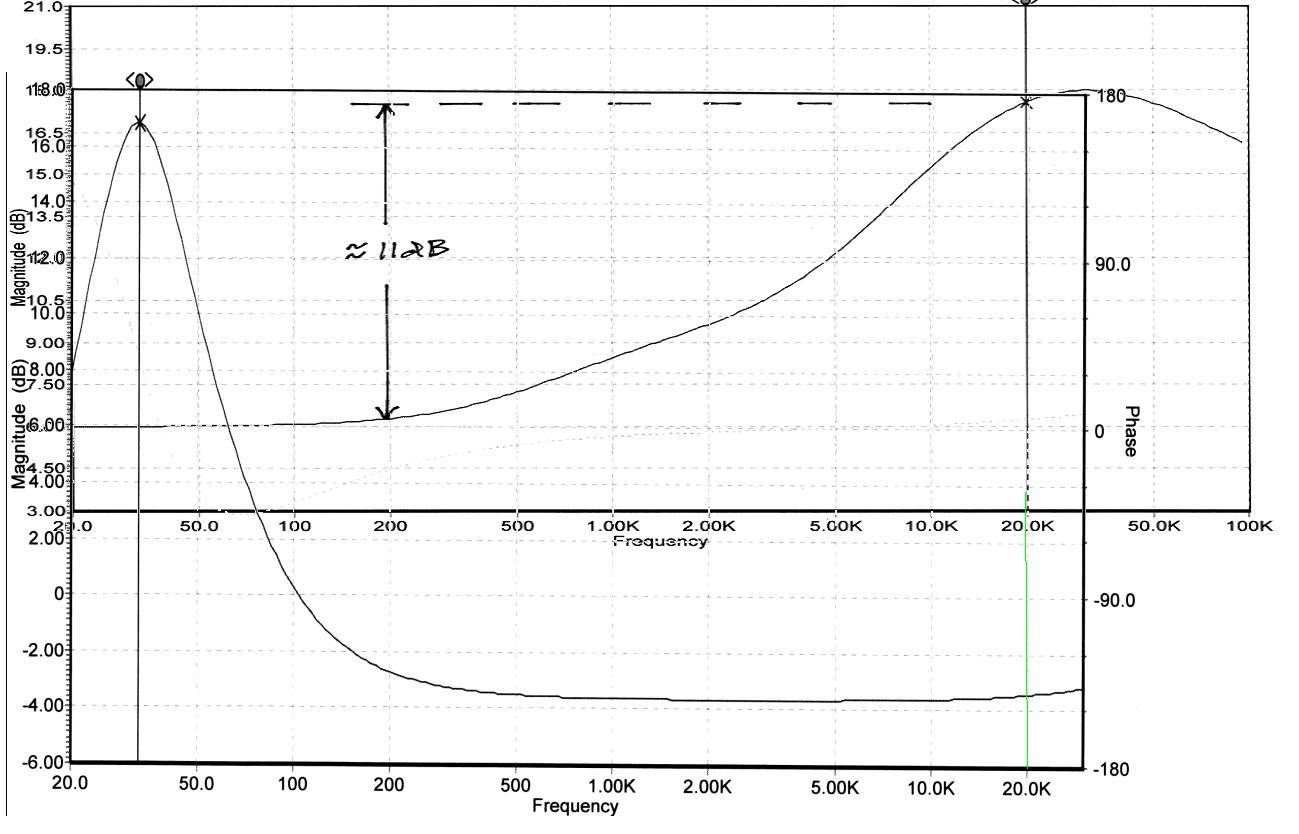
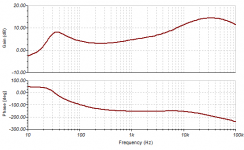
Here is the result I got when I put the circuit that Bob provided me from the Tina file and I had to switch to an ideal OpAmp rather than the one with the +/- a 15 volt input - it seems to produce the same response that I got in Akabak. The response is consistent with individual stages - they all add up to this. So the gain for the low freq seems too low and the gain for the high freq seems too high. Looks like we need to do a fanout to each stage and then set gain in separate buffer and then do a summing junction (fan-in) for final response. This way, the HF and LF boost can be individually tailored with a pot. I am driving final load of 10 kohms instead of 100 k but I think that should be fine.
Edit: In looking at the phase plot, maybe adding an 'all-pass' phase adjustment to compensate for the HF phase shift might be good?
Attachments
Last edited:
Just a note to those new to circuit simulations (like me). This free TINA software from TI is very good, super easy to use and intuitive. I am making and simulating circuits for filters and cross-overs already within 20 minutes of playing with it. I can't believe stuff this good is free - I guess they want you to use it and then buy their IC's after you design it. I am having a lot of fun with it and it has opened up a whole new toolbox for me.
Hi All,
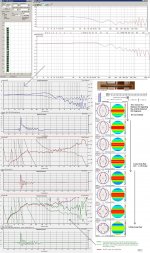
Adding two more pictures to ponder on, i,e. expanding the sims(a single 25x array) to a room with only a floor (2*Pi) and to a room of arbitrarily sized where all the walls have a reflectivity of 0.9.
b")
Adding two more pictures to ponder on, i,e. expanding the sims(a single 25x array) to a room with only a floor (2*Pi) and to a room of arbitrarily sized where all the walls have a reflectivity of 0.9.
b
Attachments
Recognize that in the near field the sound radiation is such that very little energy is radiated toward the floor and ceiling. See Figure 2 in my white paper.
http://audioroundtable.com/misc/nflawp.pdf
http://audioroundtable.com/misc/nflawp.pdf
Well, I'm a bit embarrassed that the combined circuit didn't give the result I thought it would. Sorry about that. When I have time (in the next week) I'll try reducing the gain of the upperband EQ section to match the lower band EQ section at about 300HZ, and then make up for the gain loss of the combined circuit (approx. 4-5dB) in the final output volume control buffer and line driver stage. I think that will work.
It's hard to predict what the ideal curve will be for any given room acoustics situation. I'm tempted to replace the upperband EQ section with a Baxandall section so it's adjustable. The peak height of the lowerband EQ circuit can be adjusted by varying the voltage dividers (12K and 9.53K) without significantly changing the peak frequency. A very small change in these resistors causes a big change in the curve. Replacing the low end EQ circuit with a Baxandall is no good since we really need that steep rolloff below 30HZ.
Although noise from too many opamps in the path could become an issue. Noise can be pushed down by putting a separate gain stage at the input, and a resistive attenuator at the final output, but taken too far could cause premature clipping at 30HZ. I would probably also want to have a separate Baxandall tone control circuit employed for final tweaking.
It's hard to predict what the ideal curve will be for any given room acoustics situation. I'm tempted to replace the upperband EQ section with a Baxandall section so it's adjustable.
I am putting together a model of the IDS-25 in AkAbak and it will show the native frequency response and how much EQ gain will be needed for the different frequencies. I will then play with room placement to see the effect of location of speaker relative to back wall. This may provide a series of EQ profiles that we can either make a circuit with adjustable gain - or profiles to compensate for digitally with say a Behring DEQ or a miniDSP. The model is a bit tricky as there are more nodes than I can spare (55). I have to collapse the enclosure for every 5 drivers into a single one to save nodes.
Well, I'm a bit embarrassed that the combined circuit didn't give the result I thought it would.
Bob,
Don't be.
You are way above us in design of analog circuits as I would not be able to do any of this without you.X
No EQ response of 25 driver TC9FD array
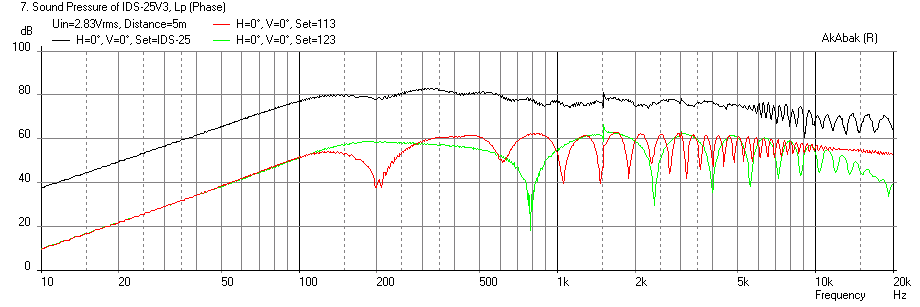
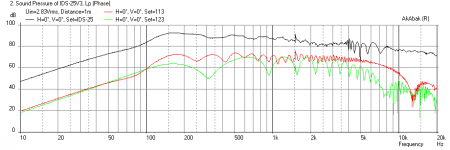
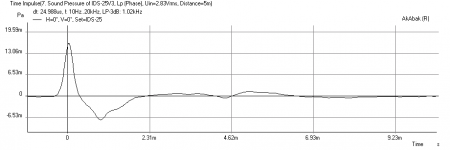
This is a simulation of a 25 driver array with 3 liters per driver sealed chamber with stuffing. 5 drivers share a common 15 liter chamber, each 15 liter chamber is connected to adjacent one with 25% CSA reduction and 0.75 in thick spacer. Driver CTC spacing is 3.56 inches. Walls are very far away and measurement is at 24 in above floor as I do not have ability to have floor and ceiling, so I am trying to get more of an average effect of what a floor and ceiling might look like.
First plot is SPL vs Freq for 1 watt at 1 meter. Black is overall (25 drivers at 1 m), red is direct radiation from middle (13th) driver at cone face, green is direct radiation from 3rd driver from the floor.
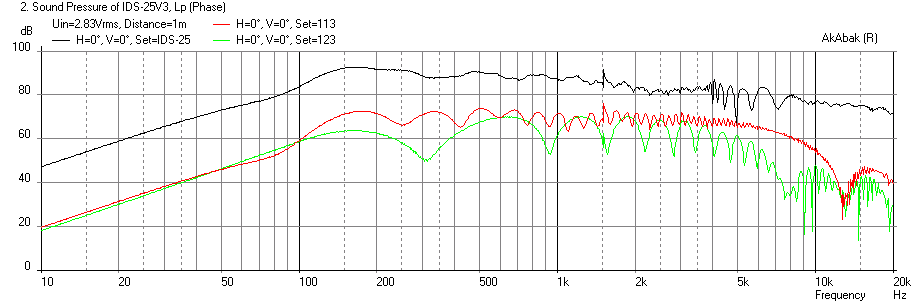
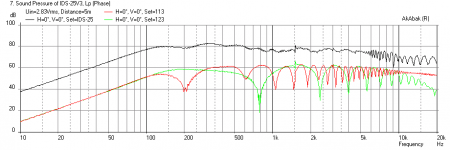
Anyhow, it looks like to get 35 Hz EQ'd to 85 dB average will take 20 dB boost. From 400 Hz to 20 kHz, a gentle 13 dB boost will be required to flatten the top end. However, if you listen to this speaker far away, which you are supposed to because these are not near field monitors, the EQ curve is much more gentle. The next plot shows the response 5 meters away and this seems to close to Roger Russell's curve (which was for a TG9FD) that about a +20 dB boost is needed at 35 Hz and +13 dB boost from 400 Hz to 20 kHz. I think the TG9FD was at 30 Hz and not 35 Hz, so the paper cone doesn't go quite as deep. However, I believe the HF performance of the paper cone is better than the fiberglass cone.
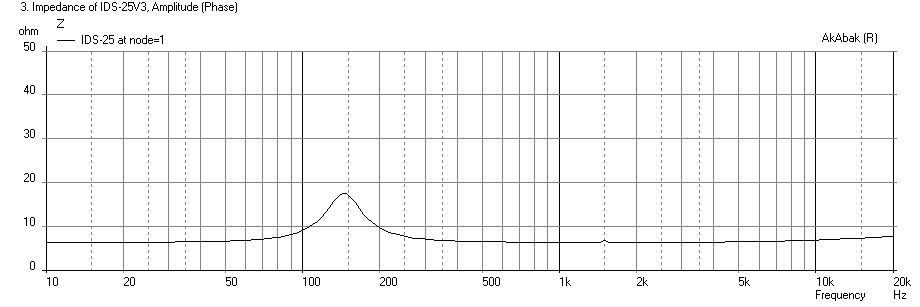
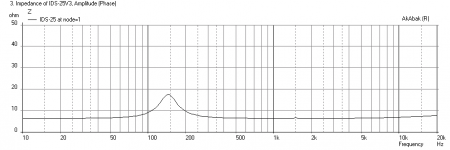
The 3rd plot shows the impedance which is very nice and easy for any amp to handle.
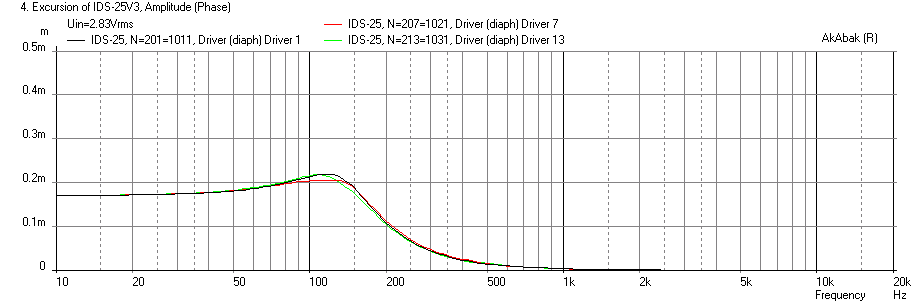
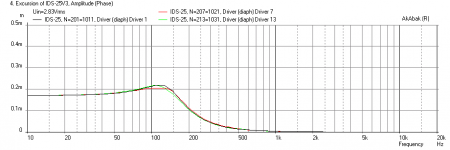
The 4th plot shows the cone displacement, which as expected is tiny so this system should be able to handle a lot of power and get really loud.
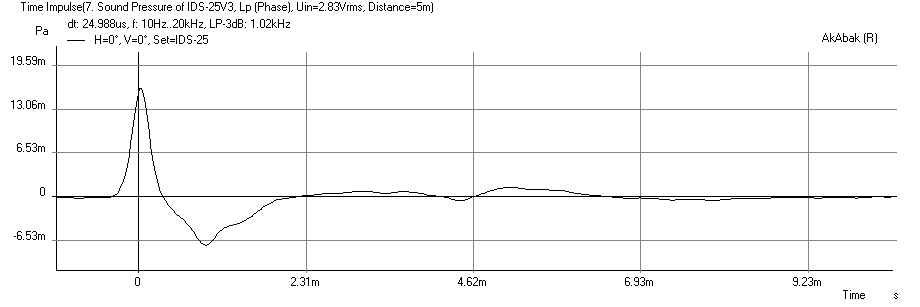
Last plot is the impulse response, which is just fantastic - clean and short. The transient response of this speaker should be awesome.
My next task is to hook up the EQ circuit output and see how it works once Bob finishes it.
Let me know what you guys think, but this gives us some foundation to believe the EQ curve proposed by Roger Russell. I can also study effect of placement of the back wall next to see how that impacts EQ curve.
This is a simulation of a 25 driver array with 3 liters per driver sealed chamber with stuffing. 5 drivers share a common 15 liter chamber, each 15 liter chamber is connected to adjacent one with 25% CSA reduction and 0.75 in thick spacer. Driver CTC spacing is 3.56 inches. Walls are very far away and measurement is at 24 in above floor as I do not have ability to have floor and ceiling, so I am trying to get more of an average effect of what a floor and ceiling might look like.
First plot is SPL vs Freq for 1 watt at 1 meter. Black is overall (25 drivers at 1 m), red is direct radiation from middle (13th) driver at cone face, green is direct radiation from 3rd driver from the floor.
Anyhow, it looks like to get 35 Hz EQ'd to 85 dB average will take 20 dB boost. From 400 Hz to 20 kHz, a gentle 13 dB boost will be required to flatten the top end. However, if you listen to this speaker far away, which you are supposed to because these are not near field monitors, the EQ curve is much more gentle. The next plot shows the response 5 meters away and this seems to close to Roger Russell's curve (which was for a TG9FD) that about a +20 dB boost is needed at 35 Hz and +13 dB boost from 400 Hz to 20 kHz. I think the TG9FD was at 30 Hz and not 35 Hz, so the paper cone doesn't go quite as deep. However, I believe the HF performance of the paper cone is better than the fiberglass cone.
The 3rd plot shows the impedance which is very nice and easy for any amp to handle.
The 4th plot shows the cone displacement, which as expected is tiny so this system should be able to handle a lot of power and get really loud.
Last plot is the impulse response, which is just fantastic - clean and short. The transient response of this speaker should be awesome.
My next task is to hook up the EQ circuit output and see how it works once Bob finishes it.
Let me know what you guys think, but this gives us some foundation to believe the EQ curve proposed by Roger Russell. I can also study effect of placement of the back wall next to see how that impacts EQ curve.
Attachments
Last edited:
Can you also plot them close to a wall? That is the recommended setup I believe. Look at all demo setups and even in his paper. Never mind, just noticed that would be your next step.
I agree with the ~ 5 Hz difference (eg 30 or 35 Hz) compared to the TG. That's what I got as well.
Should be a fun speaker.
Your quick at editing (lol)
I agree with the ~ 5 Hz difference (eg 30 or 35 Hz) compared to the TG. That's what I got as well.
Should be a fun speaker
.Your quick at editing (lol)
Last edited:
- Status
- This old topic is closed. If you want to reopen this topic, contact a moderator using the "Report Post" button.
- Home
- Loudspeakers
- Full Range
- Cloning IDS-25s