That makes a lot more sense to me. My correction only works down to 20 Hz and I cut off relatively sharp below that. Within the 20 Hz to 20 KHz I make it follow minimum phase behaviour, much like what Acourate is doing according to what you're saying.
Seems we're just talking past each other") . But generally we are after the same thing. Within the bandwidth of interest let phase follow the minimum phase. Maybe a linear phase steep cut off below that. Got it.
. But generally we are after the same thing. Within the bandwidth of interest let phase follow the minimum phase. Maybe a linear phase steep cut off below that. Got it.
Mitch, I'm not trying to be rude here. It's just that I've seen a lot of STEP responses, and yours seems to suffer somewhere along the line. I've had that myself for a long time until I found a solution. It's probably a room reflection or other anomaly but the STEP ends a bit sooner than I'd expect, even for a bandwidth limited output. Your FR plot isn't that much different from mine.
An REW plot of frequency and phase with a frequency dependant window set to ~1/6 octave would likely show what that is. Maybe it is fixable, maybe not.
I'm just wondering what it is. That's just me trying to solve the puzzle why the STEP looks different.
Seems we're just talking past each other
. But generally we are after the same thing. Within the bandwidth of interest let phase follow the minimum phase. Maybe a linear phase steep cut off below that. Got it.Mitch, I'm not trying to be rude here. It's just that I've seen a lot of STEP responses, and yours seems to suffer somewhere along the line. I've had that myself for a long time until I found a solution. It's probably a room reflection or other anomaly but the STEP ends a bit sooner than I'd expect, even for a bandwidth limited output. Your FR plot isn't that much different from mine.
An REW plot of frequency and phase with a frequency dependant window set to ~1/6 octave would likely show what that is. Maybe it is fixable, maybe not.
I'm just wondering what it is. That's just me trying to solve the puzzle why the STEP looks different.
Last edited:
That makes a lot more sense to me. My correction only works down to 20 Hz and I cut off relatively sharp below that. Within the 20 Hz to 20 KHz I make it follow minimum phase behaviour, much like what Acourate is doing according to what you're saying.
Seems we're just talking past each other
Mitch, I'm not trying to be rude here. It's just that I've seen a lot of STEP responses, and yours seems to suffer somewhere along the line. I've had that myself for a long time until I found a solution. It's probably a room reflection or other anomaly but the STEP ends a bit sooner than I'd expect, even for a bandwidth limited output. Your FR plot isn't that much different from mine.
An REW plot of frequency and phase with a frequency dependant window set to ~1/6 octave would likely show what that is. Maybe it is fixable, maybe not.
I'm just wondering what it is. That's just me trying to solve the puzzle why the STEP looks different.
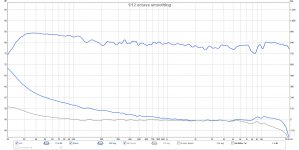
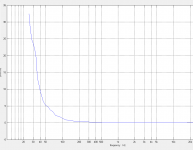
Ive been trying to follow what you mean by the bolded parts of what you said. Can you apply what your saying to the attached graph? What would need changing? Can you explain?
In my case, <27hz or so I cannot make it flat and protect my sub. So my bandwidth is limited to 27-20K.
Attachments
Last edited:
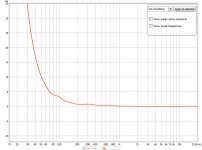
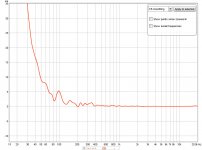
The minimum phase (if everything is optimal) follows the frequency shape closely. You can see actual phase in your plot starting to deviate from that minimum phase plot. That is creating the delay you see in the lower frequencies. This is because the phase turn is caused by the crossover type used. If we look at the above plot, at 30 Hz we can see the phase has turned 360 degrees. In other words, the signal at 30 Hz is lagging one cycle behind the initial impulse at that 30 Hz frequency. A group delay plot would show about 33 ms group delay at that point.
If the actual phase was following the minimum phase plot, we see the phase would be at about 90 degree at that 30 Hz frequency. In that case the group delay at that point would be around 8 ms. A quarter of what it is now.
But it's not as easy as to slap on a correction, as yours is a vented design.
It's text book behaviour for how it was created.
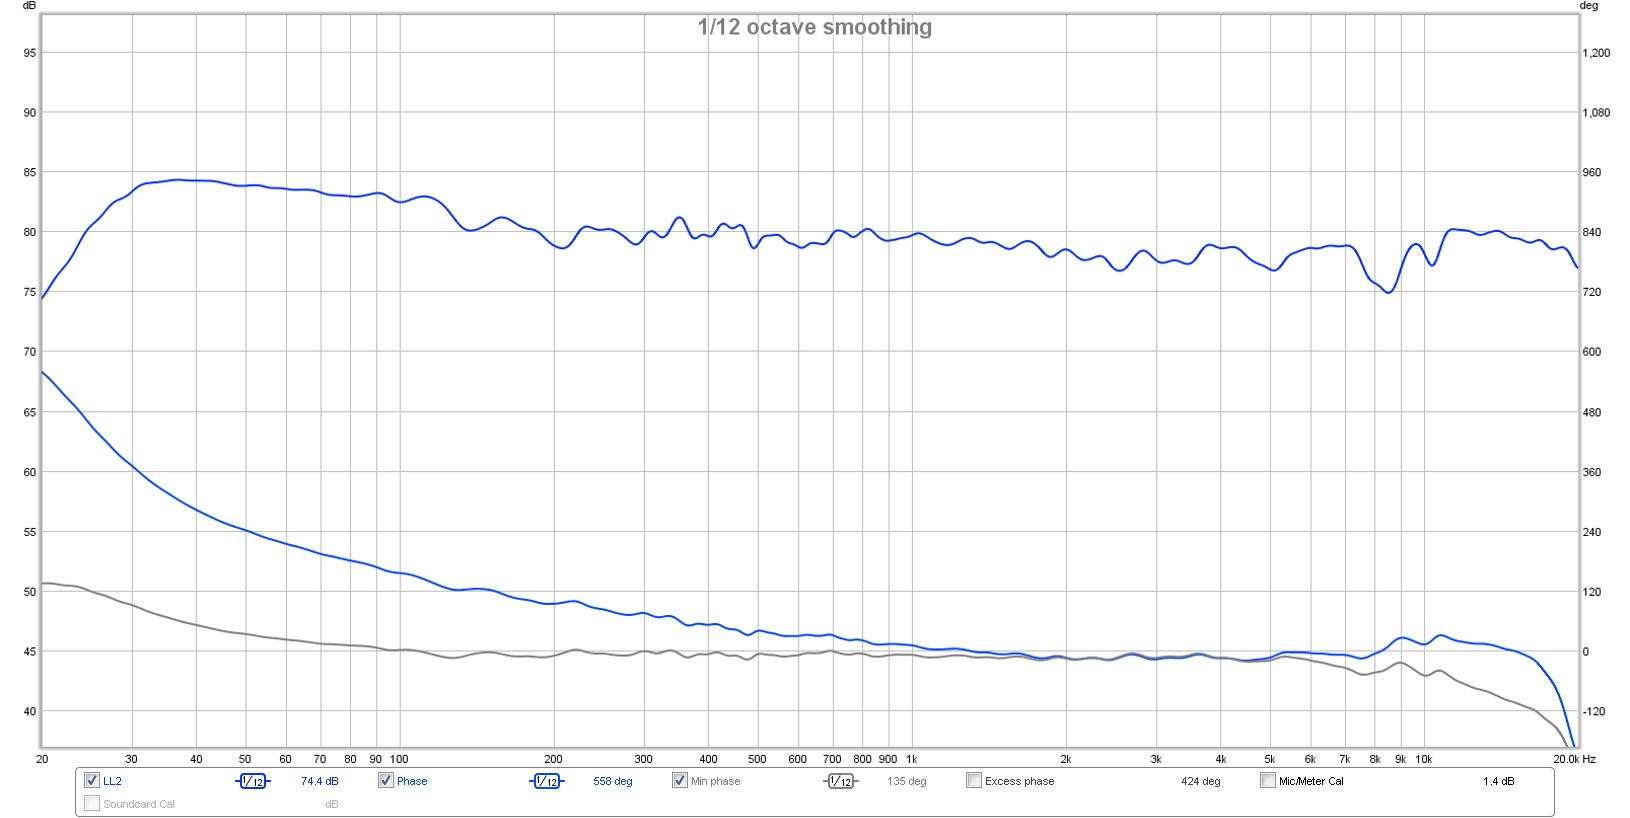
Look at these plots created by BYRTT to show a minimum phase system vs a 4th order crossover.
First the minimum phase version:
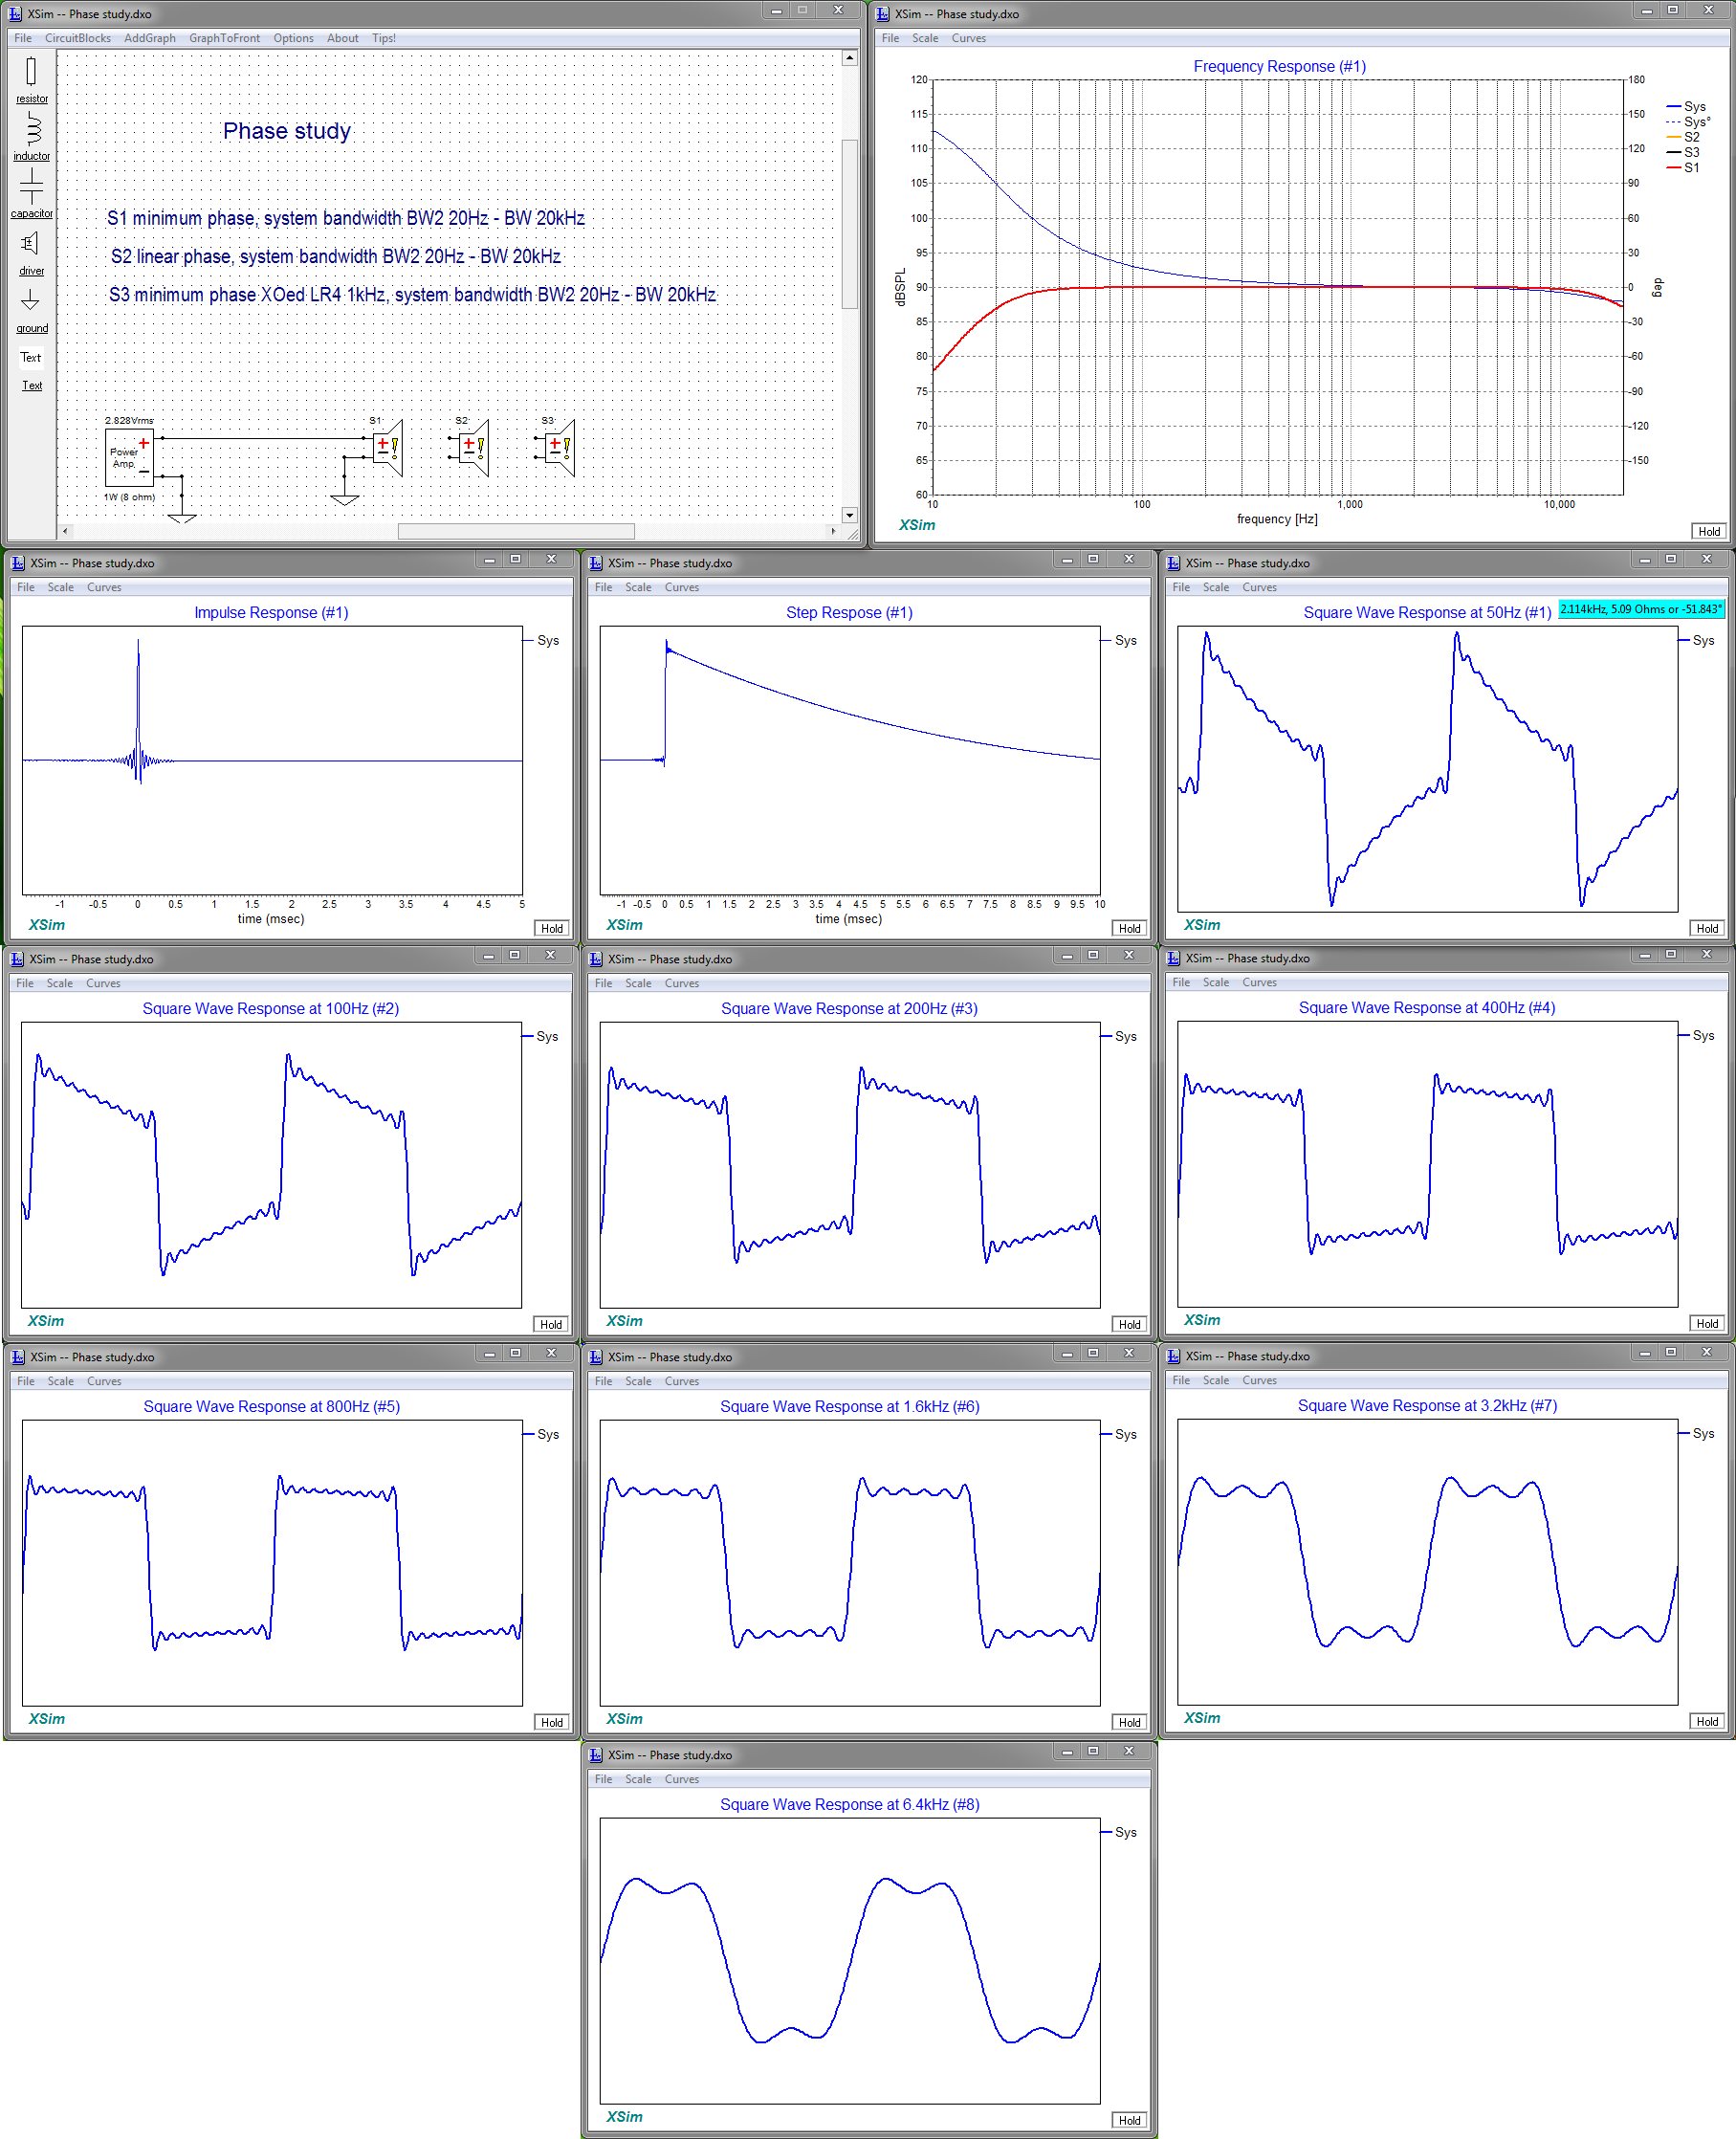
And compare to the 4th order at 1 KHz:
Look at the square wave shapes these 2 different setups play.
Your speakers have a 2th order crossover if I remember right and the effect will be somewhere in between these two plots.
But your setup has also reflex port design in the sub (and mains?) so as seen your phase rotation starts a little later and is less severe compared to that 4th order at 1 KHz.
First the minimum phase version:
And compare to the 4th order at 1 KHz:
Look at the square wave shapes these 2 different setups play.
Your speakers have a 2th order crossover if I remember right and the effect will be somewhere in between these two plots.
But your setup has also reflex port design in the sub (and mains?) so as seen your phase rotation starts a little later and is less severe compared to that 4th order at 1 KHz.
Last edited:
Thanks for your explanations. They were clear and easy to understand. I think I knew some of this before, but forgot.
While my mains are ported as well, and I am unwilling to change the, I might be willing to change my main sub from ported to sealed at some point.
Thanks.
While my mains are ported as well, and I am unwilling to change the, I might be willing to change my main sub from ported to sealed at some point.
Thanks.
I think the actual perceived delay at 30 Hz is less than in this example. If there is truth in the APL_TDA plot it says 22 ms delay at that 30 Hz frequency. You've seen how a frequency dependant window changes the group delay plot in REW. I suspect we perceive that first wave front as determining in timing. So that would be closer to that 22 ms number.
The hand over from driver to driver is very smooth, and equal for left and right channel. Meaning imaging will definitely work very well.
Is this all audible? I think so. But don't sweat it if the music pulls you in. That's what it's all about, really.
It's definitely better to have smooth phase, gradually rotating than any sudden changes. If you look at the examples in the TDA paper you're better off than many due to the effort put into your room.
One more thing, that Haas kicker you have now, with more output at the bottom and less at the top end, works better right? I've played with this myself and did try different cut off frequencies. I always need to check if they are indeed playing as I don't hear them consciously. But I do miss them if they are turned off. I even run them with movies instead of sending them true surround signals. Never even bothered yet. As this is working well and the main priority is music.
Last edited:
I think the actual perceived delay at 30 Hz is less than in this example. If there is truth in the APL_TDA plot it says 22 ms delay at that 30 Hz frequency. You've seen how a frequency dependant window changes the group delay plot in REW. I suspect we perceive that first wave front as determining in timing. So that would be closer to that 22 ms number.
The hand over from driver to driver is very smooth, and equal for left and right channel. Meaning imaging will definitely work very well.
Is this all audible? I think so. But don't sweat it if the music pulls you in. That's what it's all about, really.
It's definitely better to have smooth phase, gradually rotating than any sudden changes. If you look at the examples in the TDA paper you're better off than many due to the effort put into your room.
As sometimes its hard to notice a null/dip in the FR until its filled in, likewise, what I am hearing in the bass isnt going to reveal itself until its corrected.
Right now, I just needed a little refreshment course on what that would entail.
Just as sure as I do not know what I'm missing hearing sound in a well treated room like yours . Not until I get to hear a room like that. I know what my own panels did and that wasn't a small effect. But generally speaking we adapt to the sound we hear.
My goal is to get lost in the music, it has to pull me in. That's working pretty good lately!
. Not until I get to hear a room like that. I know what my own panels did and that wasn't a small effect. But generally speaking we adapt to the sound we hear.My goal is to get lost in the music, it has to pull me in. That's working pretty good lately!
.....While my mains are ported as well, and I am unwilling to change the, I might be willing to change my main sub from ported to sealed at some point.....
Just a thought, in that APL_TDA plot show so perfect right alignment between XO points for each band pass think if a trial listening session with little FIR implemented which correct system phase to be exactly same as frq response associated minimum phase seen in post 522, would reveal some clue if its worth pursue lower second order system roll off.
Your subsonic filter is an High Pass filter of Jriver's PE? Or is it a FIR filterI don't have subs and listen mostly to music. I can hear an audible difference when I AB filters with and without the subsonic filter in JRiver's convolution engine while listening to music. The subjective sense I get is a tighter impact and clarity in the bottom end, especially on drum impacts. After the transient impact, there is a sense of air, which I assume is the pressure equalization time. I have not formally performed an ABX test, but for folks using JRiver or other Convolution engine that can that switch filters in real time can easily test with a HP filter in and out of the signal path.
?
Just a thought, in that APL_TDA plot show so perfect right alignment between XO points for each band pass think if a trial listening session with little FIR implemented which correct system phase to be exactly same as frq response associated minimum phase seen in post 522, would reveal some clue if its worth pursue lower second order system roll off.
If you look back far enough in this thread, a sample audio track was convoluted based on my REW mdats and given back to me for playback. This gave me a sense of you mean I think.
One more thing, that Haas kicker you have now, with more output at the bottom and less at the top end, works better right?
Definitely. Even before, I knew my kicker bandwidth didn't go low enough. It just took a while to figure out how to get it to do so. I dont know about your set up, but I have to bounce the kicker off 2 surfaces to get the delay I wanted, which complicates the bandwidth issue considerably.
The sense of being in a larger space and the perception of liveliness is much more convincing now than before.
Back to the topic, I thought id go find the oldest measurement I could find and compare the GD's.
The FR's were not that different oddly.
Think what looks really good in new present one if we omit what is best FR and GD theoretical is that its smooth coherent GD as was it one wide band driver without XO and band pass ctc distance distortions.
Last edited:
Re: Audiovero - note into Uli and he is seeing if he can add the function to open a wav file tomorrow. If he does, will report back as it looks like similar functionality to APL_TDA.
Please do.
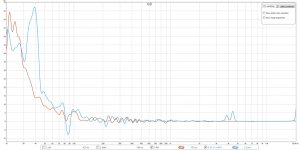
Interesting, to see the differences I've overlaid both graphs:

Not much I can say about it though. The APL_TDA software claims 10x better time resolution than the normal FFT approach REW uses. I'm not enlightened enough to know if that claim is true yet.
But it is interesting to compare these results. But I don't know which one actually is closer to the truth.
Thanks Jim, for playing along here, much appreciated. I wanted to see two things:
One, did you achieve the goal of integrating your speakers and subs with the least group delay without using digital (FIR) correction.
Two, How do the measurements suites compare, your room is the best I've seen in measurements and as such a very interesting case for comparison.
I've been thinking about this ever since you ran this test, Jim. I am starting to believe the plot of APL_TDA might really be a higher resolution look at what's happening. As it uses slices of time to get that out of the measured signal. All of REW's graphs seem much more susceptible to the influence of minor signal changes after the main peak. While working on my processing I often got the idea I was looking at interpolated results. Only with a lot of gating I could see more clear what really went down. The FDW functionality helps there but even with that it isn't always as clear. I might want to take a closer look at TDA.
I've been thinking about this ever since you ran this test, Jim. I am starting to believe the plot of APL_TDA might really be a higher resolution look at what's happening. As it uses slices of time to get that out of the measured signal. All of REW's graphs seem much more susceptible to the influence of minor signal changes after the main peak. While working on my processing I often got the idea I was looking at interpolated results. Only with a lot of gating I could see more clear what really went down. The FDW functionality helps there but even with that it isn't always as clear. I might want to take a closer look at TDA.
Its hard to make a case when the sample is only one. It would be good to get other REW vs APL_TDA examples.
I suspect (but dont really know) that DFR is not the same thing as Group Delay. At the very least, it is not calculated in the same way. If so, comparisons are apples and oranges.
If both DFR and GD use the phase slope to determine their values, it may be that they looking at different samples. Perhaps REW takes a +/- 1 octave sample where DRF takes a +/- 1/2 octave sample, for example.
Last edited:
I just ran these. The interesting part is not only the different values per frequency, but APL misses the bumps and wiggles that REW shows at 1/6th oct smoothing. Its only when I display REW at 1/2 oct smoothing do the graphs look similar.
So the question arises to why DFR doesn't show those bumps and wiggles? Is it extremely smoothed?
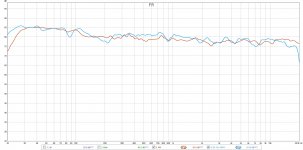
When looking at the AFR of APL vs FR for REW, it also takes a good deal of smoothing to make the plots look similar.
So the question arises to why DFR doesn't show those bumps and wiggles? Is it extremely smoothed?
When looking at the AFR of APL vs FR for REW, it also takes a good deal of smoothing to make the plots look similar.
Attachments
Last edited:
- Status
- This old topic is closed. If you want to reopen this topic, contact a moderator using the "Report Post" button.
- Home
- Loudspeakers
- Full Range
- Group Delay Questions and Analysis