wesayso, interesting. Audiovero has a similar, but free, 3D visualization tool that is based on the S Transform: https://en.wikipedia.org/wiki/S_transform
One can download the free tool here Private Area - AudioVero (type in given user name and pwd) and takes impulse pcm or wav files as input.
One can download the free tool here Private Area - AudioVero (type in given user name and pwd) and takes impulse pcm or wav files as input.
wesayso, here is a quick example: http://i1217.photobucket.com/albums/dd381/mitchatola/S Transform example_zpsh4afqwlt.jpg
One can zoom on any axis, rotate view, truncate IR, etc.
One can zoom on any axis, rotate view, truncate IR, etc.
ra7 - But both plots you mention are merely different representations of the same IR response. That's why I like the APL_TDA view, you basically "see" the group delay in that plot:

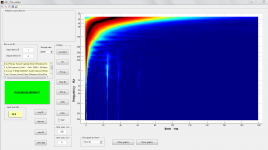
Measurement of my FIR correction with the demo version of the TDA software in my room, stereo pair at listening position.
Measurement of my FIR correction with the demo version of the TDA software in my room, stereo pair at listening position.
Last edited:
Jim, I hope you're still getting notifications for this thread, We were introduced to a tool recently, that would have been quite a big help in this quest you had at the time of this thread.
http://www.diyaudio.com/forums/full...on-what-can-we-do-dsp-power-now-availabl.html
Read the last paper, linked in the first post. The visual examples are probably all you need to look at to see my point. This tool, APL_TDA lets you see the exact timing of your speakers in the room. The Demo version is enough to show you the plots. You can't save them but it's a real nice way to see what's going on with that first wave front hitting your listening position. It will also show you a group delay plot, but the visual presentation of the enhanced wavelet view, in 2D or 3D is actually quite clear upon first sight of the graph.
Just thought I'd mention it.
Yea, I still get email notifications. Looks interesting, but I get the message:
1) wav not yet implemented
and when I hit "transform", it says
2)self params out of range
I went to a rew measurement, selected "export" "impulse response as wav". Opened the new file in STransform. What am I doing wrong?
Last edited:
The package I mentioned (APL_TDA) is here: Acoustic Power Lab :: Downloads
You both need the trail software for your platform (32 or 64 bit) as well as the Matlab compiler runtime (MCR) 2013a 8.1 mentioned on the right. It is an entirely separate measurement system.
You run a sweep and get the plots as a result. Just like REW, but based on different technology. But it does show a clear picture of the speaker and it's time behaviour. You should be able to see your subs in relation to the speaker.
Look at the paper: http://aplaudio.com/downloads/Equalizing_loudspeakers.pdf for examples. Knowing your room you should see the speaker result clearly and be able to judge the sub integration visually. That's why I thought of you.
Might be a bit more work than loading an impulse but knowing what you've done in your room") . You're probably up for the task!
. You're probably up for the task!
After installing the demo, put the right sound out (Output ID) and sound in (input ID) from the list above it (1 and 7 in my case) and run measure (as in REW). Do keep the level down at first. You can find it by Output: mono Level -10 dB in my screen grab.

It will run a short sweep and calculate the graphs and done... a visual representation of what's happening. As if you were reading the group delay without the hassle, just a visual. In 3D and 2D and the belonging frequency graph (AFR - Amplitude Frequency Response) and group delay (DFR - Delay Frequency Response) are there too. The paid version lets you do distortion etc. and save graphs and probably more as this is the base measurement suite of an entire product line. Targeted at a Pro Audio group, it should fit well with your room.
The key being the visual representation of the integration in time of your speakers and subs. A lot harder to really see in REW. See it as a high resolution version of the wavelet in REW. One that shows you that piece of information in high definition and 3D.
The STransform I do not know. That's what Mitch linked, right?
You both need the trail software for your platform (32 or 64 bit) as well as the Matlab compiler runtime (MCR) 2013a 8.1 mentioned on the right. It is an entirely separate measurement system.
You run a sweep and get the plots as a result. Just like REW, but based on different technology. But it does show a clear picture of the speaker and it's time behaviour. You should be able to see your subs in relation to the speaker.
Look at the paper: http://aplaudio.com/downloads/Equalizing_loudspeakers.pdf for examples. Knowing your room you should see the speaker result clearly and be able to judge the sub integration visually. That's why I thought of you.
Might be a bit more work than loading an impulse but knowing what you've done in your room
. You're probably up for the task!After installing the demo, put the right sound out (Output ID) and sound in (input ID) from the list above it (1 and 7 in my case) and run measure (as in REW). Do keep the level down at first. You can find it by Output: mono Level -10 dB in my screen grab.
It will run a short sweep and calculate the graphs and done... a visual representation of what's happening. As if you were reading the group delay without the hassle, just a visual. In 3D and 2D and the belonging frequency graph (AFR - Amplitude Frequency Response) and group delay (DFR - Delay Frequency Response) are there too. The paid version lets you do distortion etc. and save graphs and probably more as this is the base measurement suite of an entire product line. Targeted at a Pro Audio group, it should fit well with your room.
The key being the visual representation of the integration in time of your speakers and subs. A lot harder to really see in REW. See it as a high resolution version of the wavelet in REW. One that shows you that piece of information in high definition and 3D.
The STransform I do not know. That's what Mitch linked, right?
Last edited:
Exactly! in both 2D and 3D. The demo is free to run and thus a useful analysis tool for us freaks
The mentioned AFR plot gives the belonging frequency response, to see what timing changes do. keep an eye on both.
P.S. man I'm jealous each time I see measurements from your room!
The mentioned AFR plot gives the belonging frequency response, to see what timing changes do. keep an eye on both.
P.S. man I'm jealous each time I see measurements from your room!
Last edited:
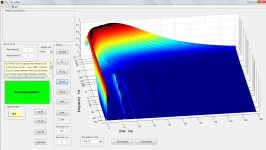
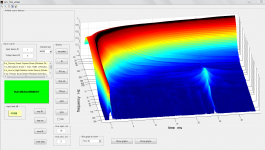
View the 30 or 40 ms window, it is set to 200 now. That will likely show the phase turn you get with the chosen crossovers, as the rest of it is remarkably clean. This shows a fluent handover from one driver to the next. Basically textbook on first sight for a speaker with crossovers. What did the DFR tab look like? That's the equivalent to the group delay I guess.
Compare to my plot, one page ago. set to 30 ms window. No group delay other than minimum phase roll off.
Remember my quest for time coherency?
Compare to my plot, one page ago. set to 30 ms window. No group delay other than minimum phase roll off.
Remember my quest for time coherency?
Last edited:

Re: Audiovero - note into Uli and he is seeing if he can add the function to open a wav file tomorrow. If he does, will report back as it looks like similar functionality to APL_TDA. Except I don't know what algorithm is being used in APL_TDA or the smoothing applied.
The Stockwell transform in Audiovero's program is a known math algorithm and seems to display more detail than APL_TDA. Will be interesting to see the comparison, but it is simply another 3D view of time energy frequency, unless I am missing something?
Ironically, 25 years ago in a dedicated inttrument that I used to measure rooms called the Techcron TEF which used Richard Heyser's Time Delay Spectronomy (TDS) and displayed the same views we see today except that instruments was over $20K.
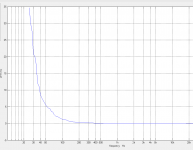
DFR - Delay Frequency Response
If in the new REW, you set a 1/6 octave frequency dependent window on your measurement, then view group delay, does it agree?
Still doesnt agree.
Very beautifull clean 3D plot jim1961, guess little more delay in lows than wesayso's are his XO-less sealed box verse multi-way XO and or ported woofer roll off.
Thanks. The 24ms ridge is there by design FYI.
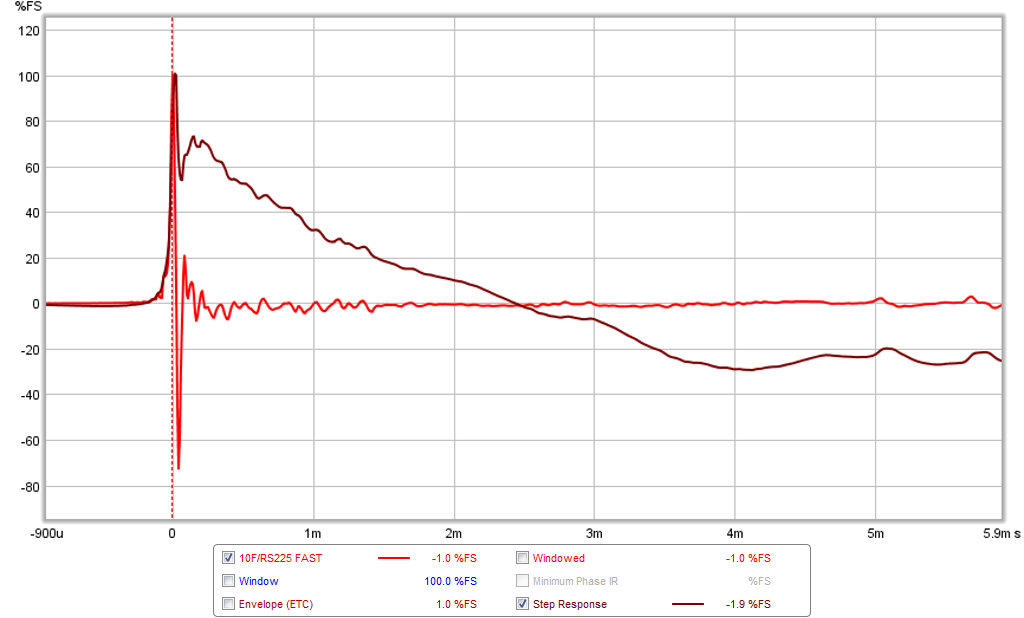
What does your impulse response look like? Click on "Step Response" and see what that looks like. If you can adjust all the time delays to get something like this - it will go from good to great (or extraordinary sounding tight bass).
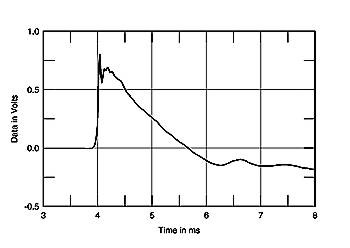
Measuring Loudspeakers, Part Two Page 2 | Stereophile.com
Here is SR and IR from my speaker - and when I got this - it knocked my socks off:
Is this a near field measurement? How many cm? In axis with which driver?
Many thanks in advance
GiAnt
DFR - Delay Frequency Response
If in the new REW, you set a 1/6 octave frequency dependant window on your measurement, then view group delay, does it agree?
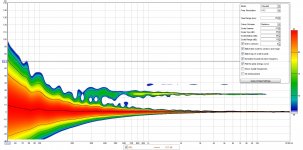
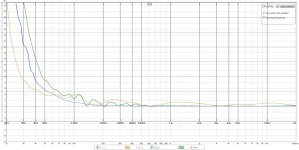
For illustration sake, adding a frequency dependent window changes the GD in REW from the green plot to the orange one.
Attachments
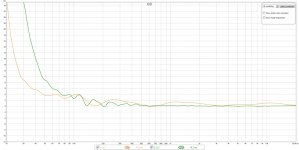
Interesting, to see the differences I've overlaid both graphs:

Not much I can say about it though. The APL_TDA software claims 10x better time resolution than the normal FFT approach REW uses. I'm not enlightened enough to know if that claim is true yet.
But it is interesting to compare these results. But I don't know which one actually is closer to the truth.
Thanks Jim, for playing along here, much appreciated. I wanted to see two things:
One, did you achieve the goal of integrating your speakers and subs with the least group delay without using digital (FIR) correction.
Two, How do the measurements suites compare, your room is the best I've seen in measurements and as such a very interesting case for comparison.
Attachments
- Status
- This old topic is closed. If you want to reopen this topic, contact a moderator using the "Report Post" button.
- Home
- Loudspeakers
- Full Range
- Group Delay Questions and Analysis