Works great! Just get used to the concept, then very intuitive.
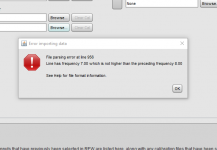
So,I ran the response for my twin-tee filter. Then I want to import it as a cal file but that threw an error, as shown. Did I do something wrong?
Edit: I thought it was related to the sweep direction so I reversed start and stop freq, no change.
Jan
So,I ran the response for my twin-tee filter. Then I want to import it as a cal file but that threw an error, as shown. Did I do something wrong?
Edit: I thought it was related to the sweep direction so I reversed start and stop freq, no change.
Jan
Attachments
Last edited:
So,I ran the response for my twin-tee filter. Then I want to import it as a cal file but that threw an error, as shown. Did I do something wrong?
Just tried the same thing on a Mac. No error, but REW does not see the generated .mdat file as a valid format (grayed out).
Yes, you need to export (not save) the filter file as .txt and then you can enter it as the cal file.
It works absolutely fantastic. I did a response of the twin-tee, then exported that as the cal file. Then did another filter response test, and that came out ruler-flat!
Thanks John - happy camper!
Jan
It works absolutely fantastic. I did a response of the twin-tee, then exported that as the cal file. Then did another filter response test, and that came out ruler-flat!
Thanks John - happy camper!
Jan
Some tips for using a filter measurement as a cal file:
- Measure the response over the range from 0 to Fs/2
- Offset the measurement so that the unfiltered parts of the response are at 0 dB. In the graph controls (gear icon top right) there is an SPL offset control, use "Add to data" to apply the offset to the response
- To remove any ripple at the low end increase the right hand IR window, 1500 ms is probably sufficient
- To best capture a sharp notch the measurement should remain linear spaced, to ensure that happens make sure the Analysis preference "Allow 96 PPO log spacing" is not selected
- When exporting the file choose to export it at the resolution of the measurement (in the export options)
- Make sure the Analysis preference to "Limit cal data boost to 20 dB" is not selected
Looks good.
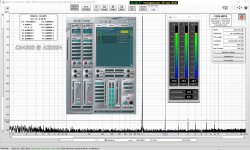
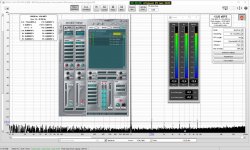
Actually it also illustrates what I mentioned before. The fundamental is at -13.0dBFS. The 2nd is at -147.9dBFS. So if you want to know the 'real' distortion, how far the 2nd is below the fundamental, you need to subtract the values and you get -134.9dBFS.
I would like to be able to set the reference to the fundamental so I am sure I don't make mistakes with the calculation ;-) .
Jan

Harmonic levels in the distortion panel are relative to the fundamental, either % or dB. The progress plot shown below the RTA graph when making a stepped sine measurement shows levels in whichever units are chosen for the RTA graph, for those to be relative choose dBc as the RTA graph units.Looks good.
Actually it also illustrates what I mentioned before. The fundamental is at -13.0dBFS. The 2nd is at -147.9dBFS. So if you want to know the 'real' distortion, how far the 2nd is below the fundamental, you need to subtract the values and you get -134.9dBFS.
I would like to be able to set the reference to the fundamental so I am sure I don't make mistakes with the calculation ;-)
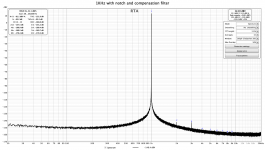
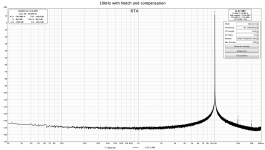
With help from John I have recorded some high resolution (512k) compensation filters for my 1KHz and 10KHz TwinT filters from Victor.
With these loaded REW is now able to reconstruct the correct magnitude of the fundamental to some 2-3 dB, which is significantly better than what I saw with the first low resolution compensation filters I made.
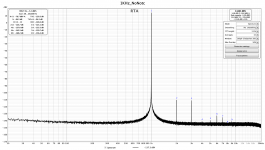
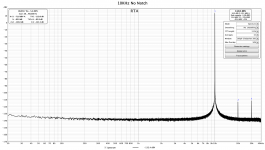
With REW and these filters loaded it seems that reliable measurements can be done in a snap without any additional user entered data. An important sanity check after the measurements is of course to compare the amplitude of the fundamental reconstructed by REW to a direct measurement of the same without notch and compensation.
With these loaded REW is now able to reconstruct the correct magnitude of the fundamental to some 2-3 dB, which is significantly better than what I saw with the first low resolution compensation filters I made.
With REW and these filters loaded it seems that reliable measurements can be done in a snap without any additional user entered data. An important sanity check after the measurements is of course to compare the amplitude of the fundamental reconstructed by REW to a direct measurement of the same without notch and compensation.
Attachments
JohnPM
Уровни гармоник в панели искажений являются относительными к фундаментальным, либо%, либо дБ. График хода выполнения, показанный ниже графика RTA при выполнении ступенчатого измерения синуса, показывает уровни в тех единицах, которые выбраны для графика RTA, для тех, кто должен быть относительным, выберите dBc в качестве единиц графика RTA.
Attachments
Harmonic levels in the distortion panel are relative to the fundamental, either % or dB. The progress plot shown below the RTA graph when making a stepped sine measurement shows levels in whichever units are chosen for the RTA graph, for those to be relative choose dBc as the RTA graph units.
OK, I haven't done the stepped sine yet. Have escaped to the beach for a few days ;-)
Jan
With help from John I have recorded some high resolution (512k) compensation filters for my 1KHz and 10KHz TwinT filters from Victor.
With these loaded REW is now able to reconstruct the correct magnitude of the fundamental to some 2-3 dB, which is significantly better than what I saw with the first low resolution compensation filters I made.
With REW and these filters loaded it seems that reliable measurements can be done in a snap without any additional user entered data. An important sanity check after the measurements is of course to compare the amplitude of the fundamental reconstructed by REW to a direct measurement of the same without notch and compensation.
Excellent! That shows how valuable the external notch filter is in such measurements, and the power of the REW software.
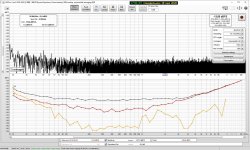
One thing I still don't fully understand: In the first graph, I see the fundamental shown in the settings box as 12.1dBV. Looking at the 2nd level in the graph I see -142dBV. So I expect the 2nd HD to be the sum, -154.1dB . Yet in the distortion box it says -157.5dB. That's a 3.4dB difference.
Maybe it has to do with your earlier question on the averaging behind the values in the distortion box?
Jan
Last edited:
Good observation! I see the same and agree.One thing I still don't fully understand: In the first graph, I see the fundamental shown in the settings box as 12.1dBV. Looking at the 2nd level in the graph I see -142dBV. So I expect the 2nd HD to be the sum, -154.1dB . Yet in the distortion box it says -157.5dB. That's a 3.4dB difference.
Yes - it might well have, and this is what troubles me.Maybe it has to do with your earlier question on the averaging behind the values in the distortion box?
Averaging progressively makes the curve "nicer" by lowering the noise floor.
In contrast the values in the distortion box keeps changing for every new cycle completed. The change is not dramatic (maybe +/- 1-2 dB, typically much less), but it is really a petty not to also average this. Or maybe even better, make the calculation once on the averaged data when the desired number of cycles have been completed. Maybe REW is already doing so, but this is not my feeling.
Well, averaging doesn't really lower the noise floor, it lowers the noise pk to pk value, squeezes the noise, sort of*. As the noise amplitude gets squeezed, the harmonics become visible and that may be why they have some value jitter during the averaging.
But yes the final values should agree.
Maybe John when reading this can shine some light?
Jan
* very long FFT records do lower the noise floor, because they have very small, sub-1Hz bins, so there is less noise in each bin. Sometimes you get lower noise floor with a very long record rather than short records with a lot of averages.
They are from the averaged data.One question for John: In the distortion panel, are the data here averaged over the multiple captures like the graph is, or is it only the calculations for the last capture that is shown? I think the last, but would prefer the first
- Home
- Design & Build
- Software Tools
- How to - Distortion Measurements with REW