Excursion should ideally be linearly proportional with voice coil current. Whenever the excursion deviates from the proportional idealn'Abend Heinrich,
Danke. But unfortunately that method does not tell us how BL decreases with excursion.
Or am I missing something and is "response curve"not referring to SPL but to BL?
- either Bl is decreasing, because the voice coil leaves the area of even and continuous magnetic flux
- and/or suspension is leaving the ideal linear area or the voice coil even hits an obstacle
I suspect in most cases the first effect (Xmax) comes long before the second (Xmech).
This is probably far too simplfied, but it may come close.
Edit: Gut' Nacht!
(Is your nick related to a lake?)
Last edited:
Unfortunately a non-optimized gap and motor geometry do not behave ideally, not to mention any a-symmetric voicecoil mounting. The Klippel plots tell us that story, often leading to less X than that simply calculated by VC lenght. What I was hoping for is a Poor Man's Klippel.....
The nick is not related to the Bodensee, but a shortened combination the family name "de Bode" and my initials E.N.. It is also my code at work.
The nick is not related to the Bodensee, but a shortened combination the family name "de Bode" and my initials E.N.. It is also my code at work.
you can translate the excursion/current graph into a relative Bl graph.
see my measurements (only positive excursion, however negative excursions can easily be measured as well):

this would translate into (note i switched X and Y axes):

you could even measure Cms, by applying a defined force to the cone (e.g. weight in the form of rice, sugar, ... 1 kg translates to 9,81 N) and measure excursion and then calculate the absolute Bl value in [N/A].
by the way: [Tm] = [N/A] because [T]=[N/Am]
if I find some time I will try to adapt my measurement!
(edit: corrected second graph!)
see my measurements (only positive excursion, however negative excursions can easily be measured as well):
this would translate into (note i switched X and Y axes):
you could even measure Cms, by applying a defined force to the cone (e.g. weight in the form of rice, sugar, ... 1 kg translates to 9,81 N) and measure excursion and then calculate the absolute Bl value in [N/A].
by the way: [Tm] = [N/A] because [T]=[N/Am]
if I find some time I will try to adapt my measurement!
(edit: corrected second graph!)
Last edited:
you can translate the excursion/current graph into a relative Bl graph.
see my measurements (only positive excursion, however negative excursions can easily be measured as well):
this would translate into (note i switched X and Y axes):
View attachment 1060057
you could even measure Cms, by applying a defined force to the cone (e.g. weight in the form of rice, sugar, ... 1 kg translates to 9,81 N) and measure excursion and then calculate the absolute Bl value in [N/A].
by the way: [Tm] = [N/A] because [T]=[N/Am]
if I find some time I will try to adapt my measurement!
(edit: corrected second graph!)
Not sure if i understand you ...
Besides the risk of burning the voice coil with excessive dc it should work fine. Just limit the dc duration!
Bl and cms are not related to frequency, as far as i know, so should be ok to be tested with dc.
And we are speaking of a low precision experiment, after all!
Besides the risk of burning the voice coil with excessive dc it should work fine. Just limit the dc duration!
Bl and cms are not related to frequency, as far as i know, so should be ok to be tested with dc.
And we are speaking of a low precision experiment, after all!
rectified AC is as deadly as DC, it has a STRONG DC component and the AC part which makes it move a little is not enough for cooling.How about rectified AC?
BTW, DC seemed infeasible in post 13.
That, besides the inherent danger involved by the very nature of the experiment: most of the time coil winding is outside the gap.
As a side note, and with much better resolution straight up and without less need to interpolation: you can use a one turn coil. place it at different heights in the gap, move it mechanically up/down where needed with a suitable screw movement and measure resultant force at each step.
Your resolution will be as high as 1 wire diameter, go figure.
We are talking 0.20 mm diameter or so.
I took the low-tech measurement further:
first I made a new measurement jig, for better readibility. it includes a scale with 500% dimensions and a measurement edge with 1:5 slope.

for keeping the exact same measuring viewpoint I took photos with camera on a tripod.
then i made a small platform for adding weight (force) to the cone.

the weight was measured with a small digital pocket scale. force was calculated: 102 g equals 1 Newton (at sea level, but that's ok i guess...).
max weight was 285 g / 2,79 N (using my leatherman tool), which was probably at the limit for this small driver.
by measuring displacement vs. force (= weight) I could derive Cms:

suspension seems to be linear until about 1,5 mm displacement.
obviously with this method I could only measure "downward" displacement.
also, the measuring may lack some accuracy - could probably be increased in a sterile enviroment") .
.
next step:
as done previously I connected the driver to a DC lab suppy to apply current. I did NOT roast the voice coil this time!
DC was only applied for short periods.
displacement / current graph is similar to the one done already.
from the Cms values for respective displacement I could derive the Bl (N/A) value.

again, keep in mind this is a rough experiment, but could of course be repeated with higher accuracy.
by the way:
according to a measurement of this driver in KLANG&TON from the 90ies Cms is 1,5 mm/N and Bl 3,2 N/A. seems to be in line with my measurements.
the manufacturer defines 2 mm Xmax, which corresponds to the Bl graph, however the suspension apparently already leaves the linear range at 1,5 mm.
note that I bought this driver around 1994 and the actual model of this driver definitely has other TSP values.
also it proves that the foam surround used by monacor does not disintegrate after 30 years!
first I made a new measurement jig, for better readibility. it includes a scale with 500% dimensions and a measurement edge with 1:5 slope.
for keeping the exact same measuring viewpoint I took photos with camera on a tripod.
then i made a small platform for adding weight (force) to the cone.
the weight was measured with a small digital pocket scale. force was calculated: 102 g equals 1 Newton (at sea level, but that's ok i guess...).
max weight was 285 g / 2,79 N (using my leatherman tool), which was probably at the limit for this small driver.
by measuring displacement vs. force (= weight) I could derive Cms:
suspension seems to be linear until about 1,5 mm displacement.
obviously with this method I could only measure "downward" displacement.
also, the measuring may lack some accuracy - could probably be increased in a sterile enviroment
.next step:
as done previously I connected the driver to a DC lab suppy to apply current. I did NOT roast the voice coil this time!
DC was only applied for short periods.
displacement / current graph is similar to the one done already.
from the Cms values for respective displacement I could derive the Bl (N/A) value.
again, keep in mind this is a rough experiment, but could of course be repeated with higher accuracy.
by the way:
according to a measurement of this driver in KLANG&TON from the 90ies Cms is 1,5 mm/N and Bl 3,2 N/A. seems to be in line with my measurements.
the manufacturer defines 2 mm Xmax, which corresponds to the Bl graph, however the suspension apparently already leaves the linear range at 1,5 mm.
note that I bought this driver around 1994 and the actual model of this driver definitely has other TSP values.
also it proves that the foam surround used by monacor does not disintegrate after 30 years!
Last edited:
How have you noticed the surround plays evil above 1.5 mm?
not sure whether it is the surround that is "evil" - i rather suspect it's the spider, or both.
this will just result i increasing uneven harmonic distorsion when driving that small speaker loud and/or low.
I noticed it when drawing the force/displacement curve (and then, drawing the Cms/displacement curve).
displacement is proportional to the force up to 1,5 mm displacement. after that the displacement does not increase proportionally anymore.
it took me about 1 second for each measurement:How long should the current "injection" last? A few seconds or so?
- switching the output of lab supply on
- releasing the camera shutter (the cone has stabilized by then)
- switching the outoput of lab supply off
I waited for some time after all measurements for the voice coil to cool down. this is just for the protection of the voice coil. it should not alter the measurements.
you will also see the voltage increase (if constant current mode) or the current decrease (constant voltage) due to heating up of voice coil.
also note that voice coil power heating it up is approximately the square of voice coil current. so, no problem for currents up to around 500 mA (-> 1 Watt for 4 ohm voice coil of a 30 Watt driver) but will already be a huge problem for 2 amps (->16 watts for a cold voice coil, but much more for a hot one with increased DC resistance due to heating up).
Last edited:
realy nice results, you could replace the manual distance readout with one the Sharp IR voltage output distance sensors for improved repeatability:


Top plot is distance sensor output and the bottom plot is drive voltage.
Top plot is distance sensor output and the bottom plot is drive voltage.
I managed to perform some measurements using a sharp GP2Y0A51SK0Fdistance measurement sensor and a scope. The distance sensor samples at ~60Hz asynchronous to the signal gen so I used 16 average mode on the scope (upper trace is distance sensor). I drove the driver at 5 Hz with a cloud VTX1200. I have also taped white paper to the cone to get a better reflectivity. The distance from the sensor can be found using the following equation (from published curve): z = (V/3.76)^(-1/0.814). From this I found a difference of 1.5 cm between the minimum and maximum value which is ~ xmax (8mm one way). Obviously easy way to improve the results would be to get the sensor closer to the cone into its more sensitive region. I also noticed some asymmetry in the clipping when not driven so hard presumably from gravity.
Quite interesting results could be obtained with some PC data logging and a current sensor as it would be possible to plot the displacement Vs coil current and also the back EMF.
that should read: voice coil current increase translates to exponential power increase (^2).also note that voice coil power heating it up is approximately the square of voice coil current.
oh yes, definitely! and it would remove a lot of hassle and inaccuracies.you could replace the manual distance readout with one the Sharp IR voltage output distance sensors
that's a great setup! did you do these measurements?
yep a while ago to check the xmax spec of the cheap pyle plpw15d woofers: https://data-bass.ipbhost.com/topic/760-measuring-excursion/
stv -
Incredible wonderful lab technique. Hooray for you. Thanks.
And the data even "holds together" in the sense that all looks OK until 1.5 mm. Casual readers may not appreciate the lab skill needed to produce data that stable.
Hmm, I wonder how loud 1.5 pp would be in my room at 35 Hz? Prolly not too loud.
B.
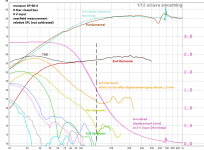
I was curious: how do the DC displacement measurements translate to THD?
attached the harmonics for the tested driver with the displacement simulation done in hornresp.
the correlation between the 1,5 mm linear displacement limit and rising harmonics is clearly visible!
attached the harmonics for the tested driver with the displacement simulation done in hornresp.
the correlation between the 1,5 mm linear displacement limit and rising harmonics is clearly visible!
Attachments
- Home
- Loudspeakers
- Subwoofers
- Is there a DIY technique to measure the BL curve of a woofer?