depends on the size of the driverI wonder how loud 1.5 pp would be in my room at 35 Hz?
")
it's not very loud with the tiny 4" driver I am torturing for my experiments ...
I was playing with this too. Bought Laser sensor to measure the cone distance, but I mostly stopped at the cone loading issue. pro drivers might need as much as 50kg weight onto the back(and front too) of the cone. That is hard to do, and harsh on the cone too. So I'm stuck but as far as I know, Klippel does all this without need of weight at Fs of the driver. He knows more. Go figure. We're too by young and dumb at this point.
"pro drivers might need as much as 50kg weight onto the back(and front too) of the cone"
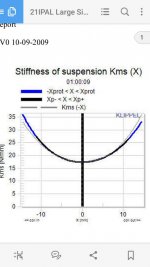
In the attachment, there is 21IPAL Kms graph. I know you can´t do it exactly that way, obviously, but at ~15mm of excursion, you have what seems to be 36,5N/mm stiffness. If you multiply the stiffness by X (15mm), you get 547N. That is, 55,7kg. It obviously will be less, due to the Kms curve, but the IPAL is supposed to move to 20mm of excustion, not 15mm, so the math will more than offset this negligence, if we are just only about the number. And so, for best hardcore, stiff drivers, you might indeed need ~50kg of weight on the cone, if not more. More ordinary drivers seem to float around 20-25kgs.Could you help me out with the underlying calculation of the 50 kgs?
Attachments
Getting the Cms this way is not gonna work, since the static stiffness is totally different than the dynamic stiffness.I took the low-tech measurement further:
first I made a new measurement jig, for better readibility. it includes a scale with 500% dimensions and a measurement edge with 1:5 slope.
View attachment 1061601
for keeping the exact same measuring viewpoint I took photos with camera on a tripod.
then i made a small platform for adding weight (force) to the cone.
View attachment 1061602
the weight was measured with a small digital pocket scale. force was calculated: 102 g equals 1 Newton (at sea level, but that's ok i guess...).
max weight was 285 g / 2,79 N (using my leatherman tool), which was probably at the limit for this small driver.
by measuring displacement vs. force (= weight) I could derive Cms:
View attachment 1061600
suspension seems to be linear until about 1,5 mm displacement.
obviously with this method I could only measure "downward" displacement.
also, the measuring may lack some accuracy - could probably be increased in a sterile enviroment
next step:
as done previously I connected the driver to a DC lab suppy to apply current. I did NOT roast the voice coil this time!
DC was only applied for short periods.
displacement / current graph is similar to the one done already.
from the Cms values for respective displacement I could derive the Bl (N/A) value.
View attachment 1061599
again, keep in mind this is a rough experiment, but could of course be repeated with higher accuracy.
by the way:
according to a measurement of this driver in KLANG&TON from the 90ies Cms is 1,5 mm/N and Bl 3,2 N/A. seems to be in line with my measurements.
the manufacturer defines 2 mm Xmax, which corresponds to the Bl graph, however the suspension apparently already leaves the linear range at 1,5 mm.
note that I bought this driver around 1994 and the actual model of this driver definitely has other TSP values.
also it proves that the foam surround used by monacor does not disintegrate after 30 years!
For this reason a DC method will be way off in some cases.
If we assume that the Rms is constant (which Klippel also does), the Bl or at least the relative difference in Bl can be easily calculated from the impedance graph. Since the height of the impedance peak is proportional to Bl^2.
One also needs to know the DC resistance for this.
Assuming that the Mms is constant (which Klippel does) in the same way we can also determine the difference in Cms, since the Fs shift is proportional to this.
One can measure the excursion with something like an IR sensor, although it's hard to get those very linear.
Another way is just simply plotting it as function of input voltage and/or current or power.
ok - would that be related to "viscosity" of suspension?since the static stiffness is totally different than the dynamic stiffness.
in consequence would that also mean the stiffness (and cms) is different for different frequencies?
The suspension becomes highly non-linear at lower frequencies. See it a bit like the RCL model for capacitors.ok - would that be related to "viscosity" of suspension?
in consequence would that also mean the stiffness (and cms) is different for different frequencies?
How significant this is depends on the many factors like softeners in the rubber and/or spider. Although if I am not mistaken Klippel assumes the dynamic compliance is constant?
Above Fs the contribution of the stiffness (compliance) will become less and less significant.
Forget to add to the other post (can't edit anymore), but Bl^2=(Zm - Re)*Rms
Zm = impedance value at Fs (max value)
Can we plot BL curve with opposite impedance polarity? For me, accurately determining the coil rest position is most important (especially when Xmax is below +/- 3mm), thanksIf we assume that the Rms is constant (which Klippel also does), the Bl or at least the relative difference in Bl can be easily calculated from the impedance graph. Since the height of the impedance peak is proportional to Bl^2.
One also needs to know the DC resistance for this.
Hi, a couple of ideas come to mind:
Applying air pressure might not be that hard to do. I once tested a couple of subwoofer boxes for leaks by sealing the speaker hole with a rubber gasket, steel baking tray and some weights put on top, and breathing into the reflex port (don't forget to line the inside with rockwool or fibre-glass batting! O/t).
As an indication of the forces involved, forcing a large 3-4L breath of air into 40-or-so litre boxes was much much easier than inflating a party balloon. A test box could be fitted with a bicycle tube valve, although the pressure might be too low to get the valve to click. A valve from a mattress or inflatable toy might a better bet.
And then find out what happens to the frequency response at various offsets!
Applying air pressure might not be that hard to do. I once tested a couple of subwoofer boxes for leaks by sealing the speaker hole with a rubber gasket, steel baking tray and some weights put on top, and breathing into the reflex port (don't forget to line the inside with rockwool or fibre-glass batting!
O/t).As an indication of the forces involved, forcing a large 3-4L breath of air into 40-or-so litre boxes was much much easier than inflating a party balloon. A test box could be fitted with a bicycle tube valve, although the pressure might be too low to get the valve to click. A valve from a mattress or inflatable toy might a better bet.
And then find out what happens to the frequency response at various offsets!
Sorry, I am not quite sure what you mean with opposite impedance polarity?Can we plot BL curve with opposite impedance polarity? For me, accurately determining the coil rest position is most important (especially when Xmax is below +/- 3mm), thanks
The BL curve is as function of cone excursion, or if we want to do it the poor man's way, as function of input voltage/power/current. (yes, getting Klippel-like graphs is not that difficult to do at home!)
As for the test, I need a bit of context, you mean the coil offset of the woofer, or when the woofer is placed inside a cabinet?
I still have my old General Radio Strobotac which turns sine waves on a cone into slow or stopped motion. Must be some equivalent dynamic measurement method for cone excursion.
Of course, with feedback, Bl curve and cone excursion irregularities wouldn't matter. Now, this morning I read the Ukranians shot down a Russian hypersonic missile which travels one mile in one second (you read that right). I wonder how that compares to DSP processing speed for a 40 Hz wave? Can we mold a wave to track cone compliance on the fly or are we already able to do that?
B.
- Home
- Loudspeakers
- Subwoofers
- Is there a DIY technique to measure the BL curve of a woofer?