That's an artifact of the input coupling cap acting as a highpass filter. A sinewave signal that starts from zero and then goes up does not just contain the frequency of the sine, it contains many frequencies, including what looks like a DC step due to the first half-wave. When that goes through a coupling cap, the highpass action removes some of the lower frequencies and the first cycles of the sinewave look like they have an exponential RC settling time added.the appearance of a constant component depending on the polarity of the first half-cycle
It was a problem I had to solve for my test setup. I wanted the soundcard to output a sinewave centered on zero from the beginning. This was not possible due to its output coupling caps. I settled with a half-cycle (or one cycle, don't remember) fade-in which nulls the DC offset.
Besides that, +1 for higher unity loop gain frequency for MOAR feedback. Especially with 2-3 pole compensation, every bit of bandwidth counts double, or even triple!
That's an artifact of the input coupling cap acting as a highpass filter. A sinewave signal that starts from zero and then goes up does not just contain the frequency of the sine, it contains many frequencies, including what looks like a DC step due to the first half-wave. When that goes through a coupling cap, the highpass action removes some of the lower frequencies and the first cycles of the sinewave look like they have an exponential RC settling time added.
You're right!
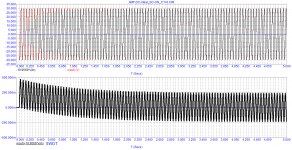
The appearance of a constant component in the signal spectrum is associated with transient processes of capacitance recharging, including the capacitances of the integrator of the servo control system.
To understand the ongoing processes, let's take an ideal DC amplifier and use a servo control system for clarity.
Attachments
-
 AMP-DC-Ideal_Servo-Control-OFF_20Hz-SWDT.png25.2 KB · Views: 62
 -
 AMP-DC-Ideal_Servo-Control-ON_(C1=0)_Bode.png23.9 KB · Views: 60
 -
 AMP-DC-Ideal_Servo-Control-ON_(C1=0)_20Hz-SWDT.png17.6 KB · Views: 62
 -
 AMP-DC-Ideal_Servo-Control-ON_(C1=2u)_Bode.png23.4 KB · Views: 53
 -
 AMP-DC-Ideal_Servo-Control-ON_(C1=2u)_20Hz-SWDT.png16.5 KB · Views: 55
 -
 AMP-DC-Ideal_Servo-Control-ON_(C1=0)_20Hz-square.png21.4 KB · Views: 52
 -
 AMP-DC-Ideal_Servo-Control-ON_(C1=2u)_20Hz-square.png21.2 KB · Views: 59

Unfortunately the topic is closed, so I'm posting the question here.
https://www.diyaudio.com/community/threads/sound-quality-vs-measurements.200865/post-2853374
«A 10 cycle pulse of 4kHz, starting from zero, has a lot of transient high frequency components - not just 4kHz.»
Does anyone know how to measure and see in reality these same components?
https://www.diyaudio.com/community/threads/sound-quality-vs-measurements.200865/post-2853374
DF96
«A 10 cycle pulse of 4kHz, starting from zero, has a lot of transient high frequency components - not just 4kHz.»
Does anyone know how to measure and see in reality these same components?
https://pastebin.com/38SLEG6g

It's a sine multiplied by a window function, so the resulting spectrum is the convolution of both spectra. For the blue one, the window is just a square pulse, so the resulting spectrum is a sinc, which really spreads.
If the signal was repeating, you could measure it with a spectrum analyzer. Or just use a soundcard and FFT.
Note if the window is really a square, which doesn't exist in the real world, then the signal is not smooth: its derivative jumps from 0 to 2piF when it starts, which means its second derivative is infinite, and such a signal can't exist in the real world.
Last edited:
Thank you peufeu!
I'll ask the question differently.
The most commonly used test signals are sinusoidal, triangular and rectangular. There are applets that demonstrate how a triangular or rectangular signal is decomposed into individual sinusoidal components. But there is nothing more to decompose the sinusoidal signal into (regardless of whether it is a single sinusoid, the first sinusoid or any other in the burst).
If a single sinusoid contains only the spectrum of a sinusoid of a given frequency and nothing else, then where do the additional components in the 1st, 5th or 10th sinusoid of the burst come from?
In my opinion additional high-frequency components arise when such signals are amplified by amplifiers with non-zero delay. The longer the signal propagation delay (tPD - time Propagation Delay) - the more additional RF components appear (especially in the first period and at the end of the burst). In ideal amplifiers (with zero delay) no additional components arise.
And how can one not recall the statement of Cyrill_Hammer here https://www.moremusic.nl/reviews/passlabs/XP-30-TAS.pdf and Graham Maynard with his FCD.
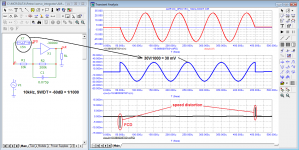
the amplifier according to this topology (Self with shiklai at the output) collected practically, the optimal initial current of the output transistors turned out to be 460mA.As an example, let's take a typical amplifier repeatedly described in various sources.
Miller's correction in this topology is no good ...
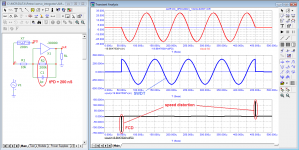
Yes, CFP is not optimum for crossover distortion, both dynamic and static (measurements):the amplifier according to this topology (Self with shiklai at the output) collected practically, the optimal initial current of the output transistors turned out to be 460mA.
Miller's correction in this topology is no good ...
- Dynamic: only a resistor pulls charge out of the base of the power devices so it has trouble turning off quickly when it should.
- Static: during the cycle, on each side, there is an interval when the power device is off but the driver is on and drives the output, causing a sharp drop in gm and current gain, along with a change in phase.
It's good for class A though, so yeah, not surprising you'd ajust the bias to a very high value like 460mA...
There is a hidden assumption: if it is periodic. If the signal is periodic, then all its periods are identical, thus you only have to analyze one period, it already contains all the information. If you analyze one period of a sine with the knowledge that the signal is periodic, that it repeats from -∞ to +∞, then the whole signal only has one frequency, that of your sine. But if you take a 10-period burst, that is not a periodic signal. The flat 0V before the tone burst and after the tone burst are also part of the signal. Even if the 10 sine periods are identical (which is possible only in theory) the whole signal is not periodic because it has a beginning and an end.If a single sinusoid contains only the spectrum of a sinusoid of a given frequency and nothing else, then where do the additional components in the 1st, 5th or 10th sinusoid of the burst come from?
The math behind FFT assumes the signal is periodic. If you cut a period out of the tone burst and look at it in isolation and apply FFT to it, then you are using a math tool (FFT) that only works on periodic signals... on a non-periodic signal. So it does not give correct results. In this case you'd have to use either Fourier transform integral on the whole signal, including the flat zero parts before and after the burst, or say the whole signal is periodic, like 10 cycles of 4kHz repeating every 50ms, which makes it a periodic signal with a period of 20Hz, and apply FFT to a 1/20Hz signal length. In the post above I used a 131072 samples FFT with Fs=90kHz so the period is about 1.4s.
peufeu, in the figure presented by you, the burst contains the level of harmonics up to -20 dB (10%). Even a few percent of the distortion is already visible to the naked eye. But we do not see anything like this on any period of the burst signal.
The microcap simulator calculates the FFT in one period, turning it into a periodic one by adding enough periods in front and behind so that the signal for rendering becomes periodic.
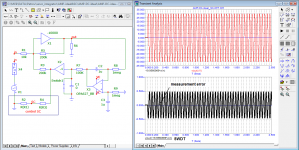
Okay, you don't trust the simulator program. In this case, we will measure the distortion by the compensation method.
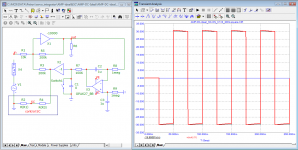
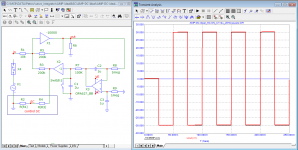
to emphasize the effect, the input signal was switched to the input of the amplifier without processing by the low-pass filter
The microcap simulator calculates the FFT in one period, turning it into a periodic one by adding enough periods in front and behind so that the signal for rendering becomes periodic.
Okay, you don't trust the simulator program. In this case, we will measure the distortion by the compensation method.
to emphasize the effect, the input signal was switched to the input of the amplifier without processing by the low-pass filter
Attachments
Of course. The periods when the sine wave is playing are just sin(wt), they are not distorted. But the spectrum below is the spectrum of the whole signal, including the silence before and after. So it is not the spectrum of a sine, because the signal is not a sine.peufeu, in the figure presented by you, the burst contains the level of harmonics up to -20 dB (10%). Even a few percent of the distortion is already visible to the naked eye. But we do not see anything like this on any period of the burst signal.
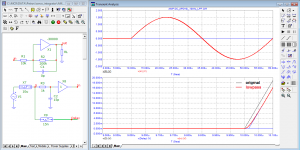
Now suppose I use a 10 cycle 10kHz sine burst, sampled at 100Msps. The top plot shows the burst (blue) and a version lowpassed (orange) with a linear phase brickwall filter cutting at 2.5MHz. The difference shows two peaks (bottom plot). There is no phase shift because it's a linear phase filter.

The frequency content of the waveform containing these two peaks is entirely above 2.5MHz. It is, in fact, identical to the spectrum of the tone burst above 2.5MHz, with the lower end cut off.
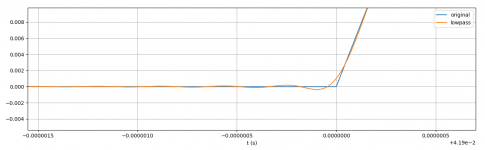
Zoom on the comparison between both signals: due to its non-smooth nature, the discontinuity at the beginning of the sine has an infinite spectrum. Therefore, it cannot be reproduced identically when going through any lowpass filter, and it cannot exist in a real signal: to get a perfect 135° angle you need infinite bandwidth, which does not exist. When lowpassing it, it becomes more "rounded" and smooth, as expected. Because this is a linear phase filter, with no phase shift, there is pre-echo, but with a more "analog" kind of filter there would be phase shift instead. This is normal expected behavior.

The frequency content of the waveform containing these two peaks is entirely above 2.5MHz. It is, in fact, identical to the spectrum of the tone burst above 2.5MHz, with the lower end cut off.
Zoom on the comparison between both signals: due to its non-smooth nature, the discontinuity at the beginning of the sine has an infinite spectrum. Therefore, it cannot be reproduced identically when going through any lowpass filter, and it cannot exist in a real signal: to get a perfect 135° angle you need infinite bandwidth, which does not exist. When lowpassing it, it becomes more "rounded" and smooth, as expected. Because this is a linear phase filter, with no phase shift, there is pre-echo, but with a more "analog" kind of filter there would be phase shift instead. This is normal expected behavior.
Peufeu, we're talking about different things.
I'm trying to draw attention to the fact that for the simulator program (in particular, microcap) it doesn't matter at what period to measure the signal spectrum, since the program itself makes a periodic signal out of it. Therefore, the program does not care what period in the ideal burst will be processed.
But at the output of real amplifiers, a lot of distortions are added, associated not only with the nonlinear properties of a particular amplifier (which can be detected in the steady state), but also with additional distortions associated with transients.
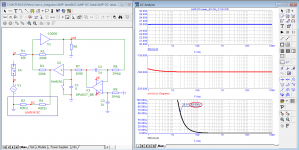
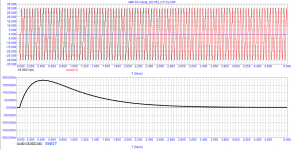
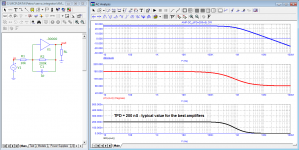
For clarity, I took the ideal DC amplifier. Since its bandwidth is infinity and the group delay is zero, it does not introduce any additional distortion into any signal (sine, triangle, rectangle, etc.). Next, I showed that even a servo control system can introduce specific distortions into an ideal amplifier. And many music lovers hear the operation of the servo control system in amplifiers.
Further, I showed that the introduced distortions depend on the signal delay time (a parameter that no one pays attention to until now) even in an ideal amplifier.
Real amplifiers have different duration of transients. For some amplifiers, this process takes literally half the period of the input signal, while for others, tens or even hundreds of periods (depending on the frequency of the signal). Two amplifiers can have exactly the same parameters measured in the steady state, but one group delay has less than 50 ns and it is constant from direct current to several MHz and then has a smooth decline, while the other has 1.5 μs, and even with the group delay rising: up to tens ms below 1 kHz and up to a few µs just beyond the audio band. Then they wonder why the parameters are the same, but the sound is different!
I'm not talking about digital signal processing, as we're talking about analog amplifiers and the distortion they introduce. And to understand why amplifiers sound different, you need to understand what parameters you need to pay attention to and how they can be measured.
I have not found in any book on amplifier design that they pay attention to this. Graham Maynard tried to make one of the first attempts to pay attention to the peculiarities of the behavior of amplifiers about 20 years ago, but he was quickly "pecked" by "theorists". He also tried to draw attention to the peculiarities of the use of inductances at the output of amplifiers, without which many amplifiers are simply inoperable. The only one who supported him was an experienced developer, John Curl.
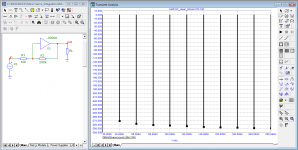
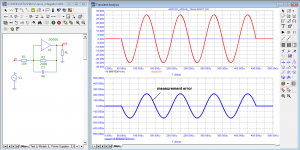
I give an example of a signal processed by a first-order low-pass filter. Unlike digital processing, we don't see any ringing (no additional RF components) before the signal arrives. In exactly the same form, the signal will be at the output of the amplifier.
I'm trying to draw attention to the fact that for the simulator program (in particular, microcap) it doesn't matter at what period to measure the signal spectrum, since the program itself makes a periodic signal out of it. Therefore, the program does not care what period in the ideal burst will be processed.
But at the output of real amplifiers, a lot of distortions are added, associated not only with the nonlinear properties of a particular amplifier (which can be detected in the steady state), but also with additional distortions associated with transients.
For clarity, I took the ideal DC amplifier. Since its bandwidth is infinity and the group delay is zero, it does not introduce any additional distortion into any signal (sine, triangle, rectangle, etc.). Next, I showed that even a servo control system can introduce specific distortions into an ideal amplifier. And many music lovers hear the operation of the servo control system in amplifiers.
Further, I showed that the introduced distortions depend on the signal delay time (a parameter that no one pays attention to until now) even in an ideal amplifier.
Real amplifiers have different duration of transients. For some amplifiers, this process takes literally half the period of the input signal, while for others, tens or even hundreds of periods (depending on the frequency of the signal). Two amplifiers can have exactly the same parameters measured in the steady state, but one group delay has less than 50 ns and it is constant from direct current to several MHz and then has a smooth decline, while the other has 1.5 μs, and even with the group delay rising: up to tens ms below 1 kHz and up to a few µs just beyond the audio band. Then they wonder why the parameters are the same, but the sound is different!
I'm not talking about digital signal processing, as we're talking about analog amplifiers and the distortion they introduce. And to understand why amplifiers sound different, you need to understand what parameters you need to pay attention to and how they can be measured.
I have not found in any book on amplifier design that they pay attention to this. Graham Maynard tried to make one of the first attempts to pay attention to the peculiarities of the behavior of amplifiers about 20 years ago, but he was quickly "pecked" by "theorists". He also tried to draw attention to the peculiarities of the use of inductances at the output of amplifiers, without which many amplifiers are simply inoperable. The only one who supported him was an experienced developer, John Curl.
I give an example of a signal processed by a first-order low-pass filter. Unlike digital processing, we don't see any ringing (no additional RF components) before the signal arrives. In exactly the same form, the signal will be at the output of the amplifier.
Attachments
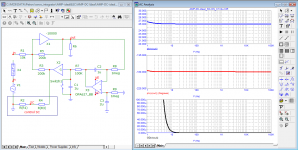
David Hafler proposed a SWDT-test and performance criteria of -70dB difference for low frequency components including mids and -60dB for HF components. Above, I showed that this requirement is met by an amplifier with a signal propagation delay of only 15 ns. I repeat that Bob Carver proved the effectiveness of this method in practice by making the sound of a tube standard indistinguishable from a transistor amplifier. In fact, (from my experience) a number of amplifiers have a signal propagation delay time of 50 to 100 ... 120 ns and practically do not introduce high-speed distortion. As far as Hafler's own amplifiers are concerned, none of his amplifiers meet the requirements of the SWDT when properly tested.
See https://en.wikipedia.org/wiki/Window_functionI'm trying to draw attention to the fact that for the simulator program (in particular, microcap) it doesn't matter at what period to measure the signal spectrum, since the program itself makes a periodic signal out of it. Therefore, the program does not care what period in the ideal burst will be processed.
To measure THD on a sine wave test tone, you need 30+ cycles and an appropriate window e.g. Hann.
OK, I've put in a 12 order digital (biquad) lowpass with cutoff at 2.5M, this has a more "analog" phase shift. It looks like expected: the main 10kHz signal is delayed by the phase shift of the filter at 10kHz, and the angle which contains an infinite bandwidth gets hit by lowpass, so it is rounded. It looks exactly like Petr's simulations, because that's what he's been doing: using a test signal with infinite bandwidth (which cannot exist as an actual input signal in reality), applying it to a simulated amp, and seeing the effects of the lowpass transfer function of the amp on the output...Peufeu, all very insightful! If I may ask, how would this look with a more 'analog' filter with phase shift?
Jan
You can measure THD on a single cycle, but if there are other non-harmonic frequencies added to the signal, then they will be interpreted as distortion while they are actually not distortion.To measure THD on a sine wave test tone, you need 30+ cycles and an appropriate window e.g. Hann.
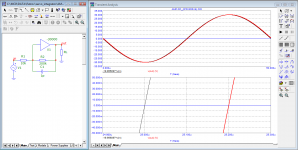
For example take a 100Hz sine (plot 1) and a 1kHz sine (plot 2), add them (plot 3) and take one period of 1kHz out of it (plot 4, it's the first period). Due to the 100Hz signal (orange) the last sample on the right edge of the 1kHz period will not line up with the first sample on the left. FFT'ing this single period will assume it is from a periodic signal, but that is not true: the period in this case is 1/100Hz, not 1/1kHz. So taking a 1ms chunk out of it is not a period of the whole signal. The waveform that is actually analyzed by the FFT can be visualized by tiling the period (plot 5). This makes the problem visually obvious.
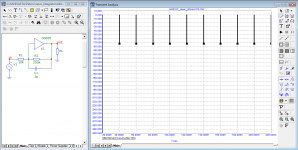
When using microcap to plot THD with default settings, it does exactly that: FFT on a single period. This means it is not possible to use it before the circuit's starting transients have fully settled, including transients due to start of the test signal. That usually requires at least 10-20 periods if the amp is DC coupled. If the amp being simulated has an input AC coupling capacitor, or it has a DC servo, and that adds a long settling time, THD simulations will be completely wrong. This problem is made worse because the DC operating point calculated at the start of the sim is often not exactly the same as the point the transient sim will settle to, so there will be a transient at the start anyway as it settles from one to the other. This can be investigated by plotting THD over each period. When two consecutive periods give the same harmonic spectrum, then one can be reasonably sure it has settled and the results are valid. Otherwise the results are bogus.
Ringing is not due to the filter being digital. It is due to the filter being linear phase. If a digital filter with a more "analog" phase shift is used, there is no ringing.I give an example of a signal processed by a first-order low-pass filter. Unlike digital processing, we don't see any ringing (no additional RF components) before the signal arrives. In exactly the same form, the signal will be at the output of the amplifier.
@peufeu, thanks for the mini-course!
Q: In your post with the 100Hz and 1kHz signal, it seems that the start and end of the two waveforms is exactly at the same moment in time. Where does the discontinuity come from?
Edit: I think I know, it is because the level shift of the zero crossings due to the summing of the two signals, right?
Jan
Yes indeedEdit: I think I know, it is because the level shift of the zero crossings due to the summing of the two signals, right?
The small portion of the 100Hz sine that is summed with that particular 1kHz period looks like a linear increasing voltage, so the second zero crossing is shifted and that 1kHz period looks distorted, but that's only an illusion, due to thinking the signal is periodic at 1kHz while it actually is periodic at 100Hz. So we can't cut a 1ms chunk out of it.
doesn't work that easily in real life.You can measure THD on a single cycle
Far better to just measure 30+ cycles and window then you don't need to worry about sampling rates, noise etc
- Home
- Amplifiers
- Solid State
- Measuring crossover distortion / bias