Yes the position of the driver is set by clicking on the driver in the crossover tab and changing the parameters.1 more thing though:
- Driver offset is to the listening axis and is filled in on the drivers in the crossover tab?
This image from the measurement preparations guide might be useful to help understand the directions
https://kimmosaunisto.net/Software/VituixCAD/VituixCAD_Measurement_REW.pdf

You can do it there in us or change the z distance on the driver in the crossover tab. The us value is displayed as a z distance underneath.
- accoustics delays are filled in on the drivers on the driver tab?
One thing to keep in mind is that the coordinate system in VituixCad does not follow the right-hand rule (which is generally used in Cartesian coordinates in math, physics, and engineering). Instead, it uses a left-hand rule.
A right-hand rule would have either the z-axis or x-axis in opposite sign.
A right-hand rule would have either the z-axis or x-axis in opposite sign.
Am I correct if i say.Yes the position of the driver is set by clicking on the driver in the crossover tab and changing the parameters.
This image from the measurement preparations guide might be useful to help understand the directions
https://kimmosaunisto.net/Software/VituixCAD/VituixCAD_Measurement_REW.pdf
View attachment 1009708
You can do it there in us or change the z distance on the driver in the crossover tab. The us value is displayed as a z distance underneath.
The acoustic centre of a woofer to the tweeter has a negative value. deeper into the cabinet (delay / Z value driver tab)
When using a sloped baffle where woofer is in front of the tweeter it has a positive value. ( Z value crossover tab)
No, Z positive is further away from the front baffle into the cabinet, so a positive z would be needed to represent a woofers voice coil being further into the cabinet than the tweeter.Am I correct if i say.
The acoustic centre of a woofer to the tweeter has a negative value. deeper into the cabinet (delay / Z value driver tab)
When using a sloped baffle where woofer is in front of the tweeter it has a positive value. ( Z value crossover tab)
For sloped baffles there is the Tilt function
These posts might help visualize that
https://www.diyaudio.com/community/threads/vituixcad.307910/post-6844528
http://www.htguide.com/forum/showthread.php?44128-VituixCAD-v2&p=639848&viewfull=1#post639848
Thanks for your help.No, Z positive is further away from the front baffle into the cabinet, so a positive z would be needed to represent a woofers voice coil being further into the cabinet than the tweeter.
For sloped baffles there is the Tilt function
These posts might help visualize that
https://www.diyaudio.com/community/threads/vituixcad.307910/post-6844528
http://www.htguide.com/forum/showthread.php?44128-VituixCAD-v2&p=639848&viewfull=1#post639848
It sure isnt intuitive. But we are getting there
") A small hoover up help text would be handy.
A small hoover up help text would be handy.I don't get the tilt function.
Someone asked if, on his 11 degree tilted baffle, where the woofer is 220mm below the setting would be like?
Tweeter (x=0,y=0,z=0,r=0,t=11)
Woofer (x=0,y=-220mm,z=0,r=0,t=11)
Then the answer was :
Tweeter X=0, Y=0, Z=0, R=0, T=11
Woofer X=0, Y=-216, Z=-42, R=0, T=11
Where the y=216mm and Z=-42mm comes from?
Triange geometry I assume. But what is the function from T=11 then? Can you not leave it T = 0 ?
Or is it to make the woofer tilted?
It could be more clear when Driver screen is driver related parameters....crossover XYZ is related to the baffle.
When repositioning the driver, YZ are "related" to each other when you fill in T?
The coordinates move the responses (set of "spinorama" measurements), not drivers. It depends on how you have measured the system what needs to be adjusted in the coordinates. The responses in the simulator need to be like they would emanate from real thing in real listening situation, for the simulation to be accurate.
From the coordinate example in your post, about tilted baffle, it looks like the measurements are done rotating around axis that is along the baffle throught the drivers, and microphone has been normal to the baffle. Just like it would be if the baffle was not tilted, like most speakers, and like the manual suggests.
Now, to reflect the simulation to reality the responses need to be aligned in the coordinate system to reflect real listening situation where the baffle would be tilted (or to test out what if baffle was tilted!). One pics a reference point, the design axis. Here it is on baffle plane, center of the tweeter. Thus tweeter is tilted T=11 and coordinates kept 0. The simulation now shows responses as listening position was tweeter height, but the tweeter now points above your head. If you imagine the situation, how a tilted baffle would look like in this situation, you realize the woofer is below and slightly in front of the tweeter, as well as has same tilt as the tweet, hence negative Y and some negative Z and the T, again to move the responses in the simulator so that they would reflect real listening situation.
If the speaker was measured with tilt in the baffle instead, mic not normal to the baffle but on equivalent angle as the tilt, then the T coordinate tilt would be left 0 because it would already be contained in the responses, and perhaps woofer Z at 0 if mic or DUT was moved to exactly same distance as it was from tweeter while measuring the tweeter.
Bottom line, the responses are made somehow, and if this somehow needs to be adjusted to match reality then you would use the coordinates. Reality = measurement rotation point(s) relation to listening spot. Listening spot is at distance along design axis, some distance along negative Z axis from origo 0,0,0.
Last edited:
Thanks for the explanation. I had to redo all my measurements(swappen + and - etc) ..but finally got thereThe coordinates move the responses (set of "spinorama" measurements), not drivers. It depends on how you have measured the system what needs to be adjusted in the coordinates. The responses in the simulator need to be like they would emanate from real thing in real listening situation, for the simulation to be accurate.
From the coordinate example in your post, about tilted baffle, it looks like the measurements are done rotating around axis that is along the baffle throught the drivers, and microphone has been normal to the baffle. Just like it would be if the baffle was not tilted, like most speakers, and like the manual suggests.
Now, to reflect the simulation to reality the responses need to be aligned in the coordinate system to reflect real listening situation where the baffle would be tilted (or to test out what if baffle was tilted!). One pics a reference point, the design axis. Here it is on baffle plane, center of the tweeter. Thus tweeter is tilted T=11 and coordinates kept 0. The simulation now shows responses as listening position was tweeter height, but the tweeter now points above your head. If you imagine the situation, how a tilted baffle would look like in this situation, you realize the woofer is below and slightly in front of the tweeter, as well as has same tilt as the tweet, hence negative Y and some negative Z and the T, again to move the responses in the simulator so that they would reflect real listening situation.
If the speaker was measured with tilt in the baffle instead, mic not normal to the baffle but on equivalent angle as the tilt, then the T coordinate tilt would be left 0 because it would already be contained in the responses, and perhaps woofer Z at 0 if mic or DUT was moved to exactly same distance as it was from tweeter while measuring the tweeter.
Bottom line, the responses are made somehow, and if this somehow needs to be adjusted to match reality then you would use the coordinates. Reality = measurement rotation point(s) relation to listening spot. Listening spot is at distance along design axis, some distance along negative Z axis from origo 0,0,0.
Till....
I read :
https://www.diyaudio.com/community/...own-speaker-from-scratch.332688/#post-5668314
Seems to me that first they substract the baffle loss from the IEC traced FRplot.
Then add the baffle loss from the cabinet they will use in their design.
I didnt do the ; "substract the baffle loss from the IEC traced FRplot" :-(
I took the TRACED FRD plot and put it in the diffraction tool. Adjust the dimensions and position of baffle, driver and mic and made the FULL SPACE traces.
Last edited:
correction: tweeter responses are tilted... Thus tweeter is tilted T=11...
Yeah, trigonometry. Forgot to answer your questions in the above postWhere the y=216mm and Z=-42mm comes from?
Triange geometry I assume. But what is the function from T=11 then? Can you not leave it T = 0 ?
Or is it to make the woofer tilted?
Tilt needs to be there, to tilt the reponses, so that the simulator shows tweeter reponse to 11deg angle and not the on axis reponse of the tweeter! Same with the woofer. Z and Y are important as well since these affect phase and the response, towards the listening spot. Also the simulator is of course using the measured response to the angle, which it can calculate from the coordinates amd listening distance. It is not the woofer on axis response (except in this case it might be just that depending on the listening distance).
Point is, with full set of measurements available the simulator is able to show response quite accurately towards listening spot. You can change position of the speaker / listening spot in the simulator to inspect how it performs in various use cases. All this is possible with full spinorama measurement data and with the coordinate system within the simulator against which it computes the interaction. In addition power and DI and other nice things can be computed and displayed as a graph.
Hope it helps
Yes Thanks a lot.correction: tweeter responses are tilted
Yeah, trigonometry. Forgot to answer your questions in the above post
Tilt needs to be there, to tilt the reponses, so that the simulator shows tweeter reponse to 11deg angle and not the on axis reponse of the tweeter! Same with the woofer. Z and Y are important as well since these affect phase and the response, towards the listening spot. Also the simulator is of course using the measured response to the angle, which it can calculate from the coordinates amd listening distance. It is not the woofer on axis response (except in this case it might be just that depending on the listening distance).
Point is, with full set of measurements available the simulator is able to show response quite accurately towards listening spot. You can change position of the speaker / listening spot in the simulator to inspect how it performs in various use cases. All this is possible with full spinorama measurement data and with the coordinate system within the simulator against which it computes the interaction. In addition power and DI and other nice things can be computed and displayed as a graph.
Hope it helps
VItuixCAD is very powerfull and can do many great things. Just needs a learning curve. As a beginner still learing about the design aspect it's not so easy and you get pretty fast on the wrong track. But still going strong and motivated
Maybe I should start a new threat for my project so I can share what I'm doing an others can correct me during the process.
I made a new thread for my project.
https://www.diyaudio.com/community/...ce-and-help-most-welcome.381215/#post-6894076
Hopefully I get some response from others to help me out. It would definitely help a lot to make it a success.
https://www.diyaudio.com/community/...ce-and-help-most-welcome.381215/#post-6894076
Hopefully I get some response from others to help me out. It would definitely help a lot to make it a success.
Well, back to the original point of this thread...
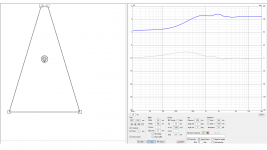
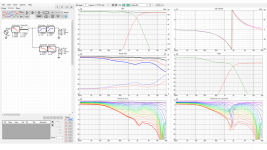
Here is a nice trapezoidal baffle shape that would not be too difficult to build. The edges are beveled or radiused at 37 mm, and there is enough space on the baffle to accommodate a 105 mm tweeter flange and a 165 mm midwoofer frame without impacting the bevel/radius.
The midwoofer has a very mild diffraction hump of 1.5 dB centered at 1.1 kHz. The tweeter has a 1 dB hump centered at 1.9 kHz. After some fiddling and tweaking, I came up with a reasonable filter: The tweeter has a 3rd order filter at 1.8 kHz, and the midwoofer has a 3rd order filter at 1.48 kHz. The crossover frequency nets out at approximately 1.6 kHz. BSC is applied to both drivers, and a mild EQ notch is applied at 2 kHz.
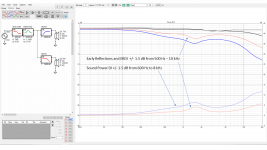
The Early Reflection curve is +/- 1.5 dB from 500 Hz to 10 kHz. The ERDI of course has the same +/- 1.5 dB from 500 – 10k variation. The Sound Power DI is +/- 1.5 dB from 600 to 8k.
The horizontal directivity is particularly nice. From 10 – 90 degrees off axis, the curves are smooth, flat, and basically the same shape. There is just the progressive roll-off of high frequencies as the off-axis angel increases.
I also found that the crossover frequency could be varied from 1.6 up to 2.3 kHz, so this is a rather versatile baffle shape.
j.
Here is a nice trapezoidal baffle shape that would not be too difficult to build. The edges are beveled or radiused at 37 mm, and there is enough space on the baffle to accommodate a 105 mm tweeter flange and a 165 mm midwoofer frame without impacting the bevel/radius.
The midwoofer has a very mild diffraction hump of 1.5 dB centered at 1.1 kHz. The tweeter has a 1 dB hump centered at 1.9 kHz. After some fiddling and tweaking, I came up with a reasonable filter: The tweeter has a 3rd order filter at 1.8 kHz, and the midwoofer has a 3rd order filter at 1.48 kHz. The crossover frequency nets out at approximately 1.6 kHz. BSC is applied to both drivers, and a mild EQ notch is applied at 2 kHz.
The Early Reflection curve is +/- 1.5 dB from 500 Hz to 10 kHz. The ERDI of course has the same +/- 1.5 dB from 500 – 10k variation. The Sound Power DI is +/- 1.5 dB from 600 to 8k.
The horizontal directivity is particularly nice. From 10 – 90 degrees off axis, the curves are smooth, flat, and basically the same shape. There is just the progressive roll-off of high frequencies as the off-axis angel increases.
I also found that the crossover frequency could be varied from 1.6 up to 2.3 kHz, so this is a rather versatile baffle shape.
j.
Attachments
Did you compare the quantity and nature of the diffraction?the crossover frequency could be varied from 1.6 up to 2.3 kHz, so this is a rather versatile baffle shape.
You might also want to try out a quasi 3rd order filter that sums at -6dB, useful for in phase crossovers where the needed delay comes from the natural offset of the drivers on a flat baffle.I came up with a reasonable filter: The tweeter has a 3rd order filter at 1.8 kHz, and the midwoofer has a 3rd order filter at 1.48 kHz.
There are targets for it built into Vituix, also for 5th and 7th order too.
http://www.htguide.com/forum/showthread.php?44128-VituixCAD-v2&p=639230&viewfull=1#post639230
http://www.htguide.com/forum/showth...e-first-Builds&p=585944&viewfull=1#post585944
Did you compare the quantity and nature of the diffraction?
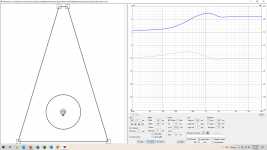
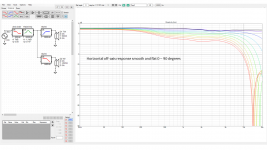
In general, I am looking at the ERDI and Sound Power DI curves, and looking for good behavior. Here is what it looks like with a nominal 2 k crossover. The general shape of the DI and ERDI is nice with the bump in DI just slightly higher. It is perhaps even a bit nicer than the above example at 1.6k. However, the on-axis and listening window curves are starting to diverge, which bothers me a bit. So it is a toss-up between this example and the post#111 example.
Fluid - I remember reading Kimmo's thoughts on the quasi 3rd order, but I forgot about till you mentioned it... need to go back and re-read it.
j.
Attachments
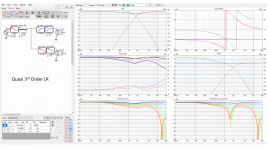
Regarding the Trapezoid baffle of post #111
Quasi 3rd order LR. This looks slightly better than my previous efforts. I should point out that all these sims assume no delay between the drivers.
The EQ at the crossover frequency may or may not be beneficial... a small dip between 1k-2k is pretty harmless. Using real drivers in a real system would change the EQ anyway. But the important point is that EQ does not change the DI or ERDI.
j.
Attachments
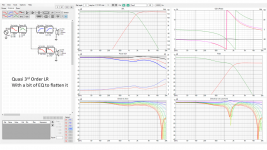
If you add a bit of z depth to the woofer which is most likely the case in reality the result should improve.Regarding the Trapezoid baffle of post #111
Quasi 3rd order LR. This looks slightly better than my previous efforts. I should point out that all these sims assume no delay between the drivers.
Phase seems to be about 90 degrees apart through the crossover, which makes the response. That's it, it is a feature not a problem and the implication is seen in the polar responses (which sound power and DI summarize). No need to reverse or anything to see if it works or not since all the data is visible all the time, beauty of "spinorama".
But, i suspect Hifijim might have tuned some parameters looking at the phase traces. At least this is what I've done many times with phase aligned crossovers. It is quite easy to see if the mouse is scrolling a parameter to right direction, if the phase traces get to better/closer alignment or worse, even if the frequency response was a mess it is rather easy to navigate towards working configuration this way. Slopes, phase reversal of drivers, delays, all easy to get into ballpark looking at the phase traces especially with phase aligned xo like LR4.
But, i suspect Hifijim might have tuned some parameters looking at the phase traces. At least this is what I've done many times with phase aligned crossovers. It is quite easy to see if the mouse is scrolling a parameter to right direction, if the phase traces get to better/closer alignment or worse, even if the frequency response was a mess it is rather easy to navigate towards working configuration this way. Slopes, phase reversal of drivers, delays, all easy to get into ballpark looking at the phase traces especially with phase aligned xo like LR4.
Last edited:
I like your approach...it teach me a lot.
I am glad you find it useful. I am trying to discover some patterns and guidelines so that there is less trial-and-error for me when I set up a baffle. In the process, I want to share what I am learning so that others can benefit. Of course I also pick up knowledge from many contributors along the way.
It is funny how lazy I have become ! This is all simulation anyway, and the whole point of simulation is to make iterations easy and fast, versus building prototypes which is difficult and slow... and yet, I am trying to make the sim process go faster.
What tmuikku says is correct. Some baffle layouts seem to work well with a LR2 or LR4 crossover, but others seem to work best with a 3rd order. A characteristic of a 3rd order crossover is that there is a 90 degree phase difference between the mid and the tweeter. In the case of Quasi 3rd order LR filter in post #115, I simply matched the target functions provided by VituixCad2... no additional tweaking. And it worked quite well.
j.
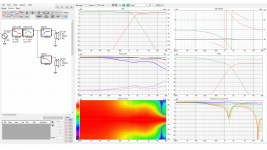
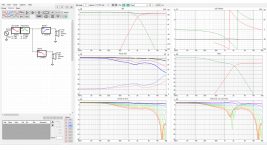
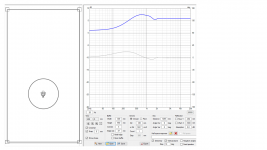
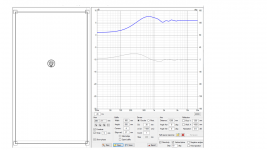
For the next sim I use a simple rectangular baffle. It is rather large for a 2-way, 550mm x 300 mm. Unlike the previous sims, this one has a lot of baffle surface above the tweeter. This seems to be a feature of many well-regarded speakers, so I wanted to experiment with it.
Once again, the mid driver is a typical 6” cone with an Dd of 125 mm, and the tweeter is a typical large dome with a Dd of 30 mm. They are placed as close together as practical. My goal is a crossover nominally at 1.8k. I use a low-q second order shelf as the BSC to get the response as flat as possible from 100 to 1000 Hz.
The first sim is LR4 crossover. For both drivers, I used two 2nd order filters cascaded in series to produce the 4th order slope. This allows more flexibility than simply using a straight LR4 filter element. I used the VituixCad2 optimizer function to match the ideal LR4 slope for each driver. Using the woofer for example, I initially set both 2nd order low pass filters with f=1800 and Q=0.7. The optimizer cranked for a few hundred iterations and came up with filter 1 at 2276, Q=0.47 and filter 2 at 1758, Q=1.2. The result, when combined with the woofers natural diffraction response and the BSC, is very close match to the ideal 1800 Hz LR4 curve.
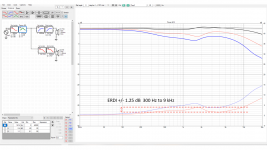
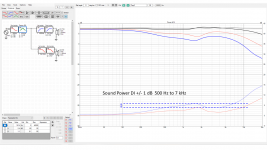
Looking at the 6 pack, the result is pretty nice. The on-axis and listening window curves are flat, and they match each other. The ERDI curve is +/- 1 dB from 300 to 9k. The sound power DI is +/- 1.25 dB from 500 to 8k. All that is very good. Looking at the horizontal off-axis response, we start to develop a 2 kHz dip at 40 degrees, and it by 70 degrees it has grown to -4 dB. This may or may not be important, depending on the room. Another possible issue with an LR4 response with this baffle is that the mid and tweeter are in the same plane, i.e. there is no z-offset between them… if this is an active crossover application, adding some delay to the tweeter to bring them into alignment is no problem. However, if this a passive crossover, additional tweaking will be needed.
j.
Once again, the mid driver is a typical 6” cone with an Dd of 125 mm, and the tweeter is a typical large dome with a Dd of 30 mm. They are placed as close together as practical. My goal is a crossover nominally at 1.8k. I use a low-q second order shelf as the BSC to get the response as flat as possible from 100 to 1000 Hz.
The first sim is LR4 crossover. For both drivers, I used two 2nd order filters cascaded in series to produce the 4th order slope. This allows more flexibility than simply using a straight LR4 filter element. I used the VituixCad2 optimizer function to match the ideal LR4 slope for each driver. Using the woofer for example, I initially set both 2nd order low pass filters with f=1800 and Q=0.7. The optimizer cranked for a few hundred iterations and came up with filter 1 at 2276, Q=0.47 and filter 2 at 1758, Q=1.2. The result, when combined with the woofers natural diffraction response and the BSC, is very close match to the ideal 1800 Hz LR4 curve.
Looking at the 6 pack, the result is pretty nice. The on-axis and listening window curves are flat, and they match each other. The ERDI curve is +/- 1 dB from 300 to 9k. The sound power DI is +/- 1.25 dB from 500 to 8k. All that is very good. Looking at the horizontal off-axis response, we start to develop a 2 kHz dip at 40 degrees, and it by 70 degrees it has grown to -4 dB. This may or may not be important, depending on the room. Another possible issue with an LR4 response with this baffle is that the mid and tweeter are in the same plane, i.e. there is no z-offset between them… if this is an active crossover application, adding some delay to the tweeter to bring them into alignment is no problem. However, if this a passive crossover, additional tweaking will be needed.
j.
Attachments
- Home
- Loudspeakers
- Multi-Way
- VituixCad Simulations with Ideal Drivers