fluid, mabat 0,1 mode sims are wavefront at throat and the frequency response /polar plot seems to relate the throat size. The 3,5kHz is lower than this and is some other issue with the driver that doesn't produce the first axial mode in the wavefront but something else.
Like I said this could be pure coincidence 😀 These are some first driver I found form the Test Bench.
aragorus, gotta think how the 0,0 mode and 0,1 (and other modes) "sum" with some ratio and form the total output of the system. Without knowing how the modes compose I tried to think about mabats visualizations and what 0,0 and 0,1 summed at some ratio would look like. There should be a slight dip ~6kHz and on axis peak at ~15kHz if the 0,1 mode is loud enough. I tried to look the measurements if any of this is seen in real devices (with some random horns they happen to be measured in).
I think these few db effects is the most that we'd ever see on modern devices.
Attachments

Last edited:
I couldn't help but notice that the source in all 3 cases looks pretty much flat.
Am I missing something?
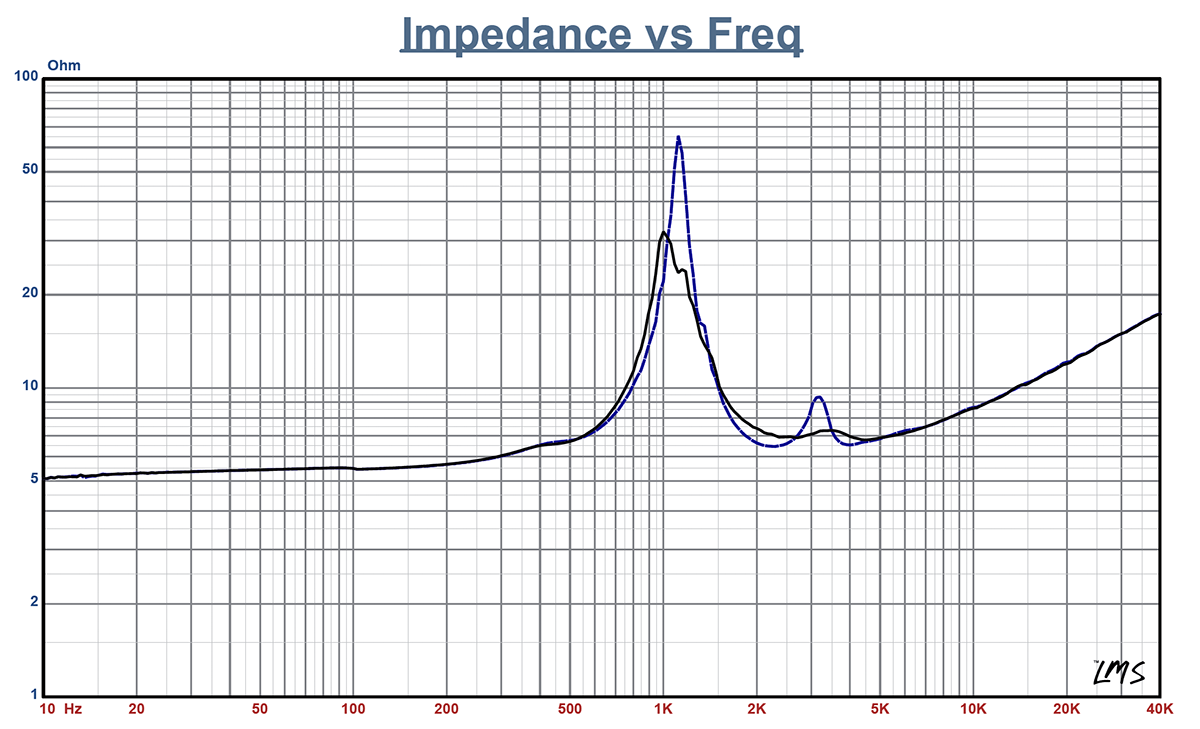
You missed what s going on at 3,2kHz impedance?
//
Yeah not sure if any of you can follow my posts so one more 😀 main point was I tried to look around if the 0,1 mode would be seen on some real measurements as it was the most prominent mode on sims mabat posted few weeks ago and thus the most likely candidate to be seen in measurements.
It looks like on some measurements yes, a few db effect might be there if it is the 0,1 mode and not something else, so it is the worst case scenario in my opinion. Mind you there are a lot of modes and "issues" with drivers (motors and phaseplugs) that could happen, I just don't know what their effect is on the output wavefront. Question was if it is worth it to try to address some of the output modes with waveguide design. My hunch is there is no need, if driver with good enough wavefront output is chosen, which seems to include most of the drivers.
TNT, others, yeah the drivers have a lot of impedance wiggle. Particularly interesting is the first axial mode 0,1 output that could possibly show in the impedance plot, and then as mabats simulations show in the frequency response / polar plot mostly as a dip at ~6-10kHz and an "on axis peak" at ~15-20kHz or thereabouts 🙂 On a 1,4" driver this was lower in frequency, and 2" lower yet.
edit. mabats sims start from post #6990, 2" throat at #7022
Last edited:
A mode is defined by the amplitude and phase (polarity) distribution across the throat area, which is considered flat here, as for a true flat wavefront. You can imagine a set of concentric rings that each vibrates with a different amplitude and phase - this is actually how it's simulated.I couldn't help but notice that the source in all 3 cases looks pretty much flat.
Am I missing something?
This was what I asked earlier, how accurately can this model describe a real wavefront at the exit of a driver that has a conical section there, not a duct. It's still an approximation - the better the closer is the output section to a cylindrical duct. Maybe I could also try to map the same distribution across a surface of a spherical cap corresponding to the exit engle of some driver, to see what difference does it make.
As the simulations match the real measurements quite closely approximately up to a frequency where the first higher duct modes start to propagate (12 - 13 kHz in a case of 1" throat), I believe these modes are really what makes the sims to deviate from the reality above that. But I would need to try to actually calculate (i.e. estimate) the weights of the modes and see how close I'm able to get to the real data.
Last edited:
I know and I know what you meant, I was just pointing to the fact you said no obvious faults when there was a glaringly obvious fault much worse than any potential mode issue.fluid, mabat 0,1 mode sims are wavefront at throat and the frequency response /polar plot seems to relate the throat size. The 3,5kHz is lower than this and is some other issue with the driver that doesn't produce the first axial mode in the wavefront but something else.
Yeah, thanks for clarifying. That was just an example that didn't show hints of the 0,1 mode. Carry on 🙂
Last edited:
I think the only way to recognize a presence of a higher duct mode at the source is its effect on polar response.

For example this is the sand horn, measured with a Beyma driver (courtesy of BV, who has the horn up and running). It seems clear how the first axisymmetric mode enters the picture above ~13 kHz and peaks around 17.5 kHz. This is pretty much in agreement with the simulations.

Attachments

Now something very close to the ST260 waveguide - mode 0,1 added to the fundamental (0,0) in different ratios (independently of frequency).
Weights of the mode 0,1 relative to the fundamental, on plots from left to right: 0.0 (i.e. the fundamental only), (+)0.1, (+)0.25, (+)0.5.
(+) means the modes are in the same polarity on-axis.
Weights of the mode 0,1 relative to the fundamental, on plots from left to right: 0.0 (i.e. the fundamental only), (+)0.1, (+)0.25, (+)0.5.
(+) means the modes are in the same polarity on-axis.
Attachments


Nice, the +0.5 mix looks to have similar pattern going on as in the celestion driver response on the previous page?
If I remember I think i've seen the - 0.25 lookalike results while trying out the various ath parameters few months ago (with a flat source). Need to look them up, if it could be a potential countermeasure? Not sure if I stored any of the poor looking results but if it was something real you might have seen it as well.
... Or just use another driver 🙂
Last edited:
Well there are still two possible sources of such abberations - 1) higher modes at the source itself and 2) higher modes and various diffractions due to the waveguide geometry, no matter how clean is the source. We still haven't really examined the latter, which seems a lot harder to do.


It seems obvious to me, at least, that the driver details matter more than the waveguide and that the waveguide can be optimized to any degree through simulations like ATH. This means that the driver is the dominate influence above several kHz. The question that seems to be battered about is: "Could the waveguide compensate for driver errors?"
I hate to be pessimistic, but that seems highly unlikely to me. The driver errors, like diaphragm resonances etc. are going to be frequency dependent - phase and amplitude. Could a waveguide be designed to "track" these errors? - wow, that's a leap of faith. It could be done at a single frequency and hope that it doesn't get worse elsewhere.
At least that's what I have found.
- I was thinking once again about the input wavefront shape (i.e. the higher duct mode(s) at the exit of a compression driver), its measurement and subsequent usage.
Perhaps the following could be done: I would create a freely available waveguide model - something smallish that everyone could download and (let it) print on a 3D printer. Then from a prescribed set of SPL measurements on this waveguide a specialized program would calculate the coefficients of the modes, i.e. the "shape" of the wavefront for a particular driver used (it would have the knowledge of the simulation results of what each mode does on that particular waveguide). This way, if there was enough interest, quite a large database of various drivers could be collected.
The question is, however: would this be of any use in the end? Are we able to design a waveguide utilizing the knowledge of an actual input wavefront to make even better results? I can't imagine how would I do that. Some crazy optimization?
I would prefer to similate from the diaphragm. I doubt it is possibly to simulate wave front with the correct shape and velocity at the thoat.
And the same for a wider waveguide (120 deg) -
If you use a wavefront that is like a normal diaphragm, that is what you get. The compression factor of a driver, which would not be contant over a bandwidth, should vary the results.
- Home
- Loudspeakers
- Multi-Way
- Acoustic Horn Design – The Easy Way (Ath4)