Regarding the profile curvatures, I found an old picture of an isolated SE extension (SE = superellipse):

As the graph shows, the curvature increases smoothly (almost linearly as a clothoid) to a point of a maximum, and then it decreases again to a point where the contour connects to a baffle (which has zero curvature). Note that in this graph it's not along the curve but as a function of x, i.e. the decrease is actually more gradual along the profile (it's similar to the initial increase, only the other way around).
I claim that for a baffle-mounted shape it just can't be better")
As the graph shows, the curvature increases smoothly (almost linearly as a clothoid) to a point of a maximum, and then it decreases again to a point where the contour connects to a baffle (which has zero curvature). Note that in this graph it's not along the curve but as a function of x, i.e. the decrease is actually more gradual along the profile (it's similar to the initial increase, only the other way around).
I claim that for a baffle-mounted shape it just can't be better
Last edited:
Wouldn't the 'ideal' be a linear increase in curvature which switches to a linear decrease in curvature at a half way angle? E.g 0°-90° throat to termination, so you switch at 45°. At least for mounting to an infinite baffle, rather than having the sharper drop at the end.
But there's no sharp drop at the end. Actually both ends of the curve have roughly the same curvature rate when taken along the profile, which is an arc of a superellipse.
When I get the time, I will show it along the curve. The graph above just needs some more imagination.
When I get the time, I will show it along the curve. The graph above just needs some more imagination.
Last edited:
Can you please do the same parameter "; descriptions" for the R-OSSE profile? Also (and only if not too much additional work), any chance the OSSE and ROSSE links to Desmos on your website be modified to utilize the same parameters letter currently utilized in ATH? It would make visualizing/understanding the impact of parameter adjustments a lot easier for a slow learner like meAs for the backward compatibility, also some might have noticed that it's now possible to define an OSSE horn simply like this:
Code:OSSE = { r0 = 19 ; Throat.Diameter/2 a0 = 41.0 ; Throat.Angle a = 71.25 ; Coverage.Angle k = 1.3 ; OS.k L = 19 ; Length s = 1.12 ; Term.s n = 2.467 ; Term.n q = 0.999 ; Term.q }
So there are the OSSE and R-OSSE profiles now (as described on my website), both using a similar notation.
(The parameter 'q' meaning different things in both but I won't change that...)
I see no need for the old rollback feature anymore. If you still want or need it, just use the old version...
.Here's measurements of my latest waveguide, created with ATH and ABEC:
https://www.diyaudio.com/community/...e-two-way-unity-waveguide.342019/post-7372395
https://www.diyaudio.com/community/...e-two-way-unity-waveguide.342019/post-7372395
Thanks for posting those measurements, @Patrick Bateman. I struggle to grasp coverage and directivity index design goals. Will you please explain your thought process behind the coverage/DI choices you made in this design? For example, why did you choose to increasingly narrow coverage above 2,000Hz at the rate you narrowed it. Based on your Geddes reference I suspect you did it to create a specific type side wall reflection but I'm not sure if I understood that correctly.
Thanks

Thanks
Not sure if I did this correctly but it's my first attempt at measuring an 8 inch free standing waveguide on a B&C DE111. Gated with 1/24 smoothing. Normalized to 10 degrees. (10 degree increments)

Simulation normalized to 10 degrees. (5 degree increments)

Simulation normalized to 10 degrees. (5 degree increments)
Hi, in genral it looks very close match to simulation, except all the undulations that seem to increase in magnitude off-axis and have some kind of periodicity. Very interesting, not clear at all what makes it. Perhaps the device is resonating? cancels itself out on-axis
Ideally the response could look just like the sim. Since the top octave looks very close the sim I would expect rest of it would too.
Ideally the response could look just like the sim. Since the top octave looks very close the sim I would expect rest of it would too.
I suspect that something is wrong with the measurement, as if a reflection was increasingly included in the time gate as the angle increases. The beats are a bit strange though, I have no explanation for that. Perhaps it would be helpful to see the non-normalized data. Otherwise the match is astonishing.
Last edited:
All right, this is certainly not gated as it should be, i.e. reflections are still present in the time window(s) of the impulse responses from which these frequency responses are calculated. With a proper gating it will be all clean and smooth. I don't use REW myself so I can't help with the details.
Here is an example of what happens if the time window (gate) is corrupted by reflections.
This is a tweeter impulse response, and I have a reflection beginning at about 3 ms.

If I select the gate window so it does not include the reflection, I get this response

If I use a longer 4 ms window, I am now getting the reflection. If the time gate includes reflections, the frequency response is no longer quasi-anechoic.

We can clearly see the undulations from 500 - 5000 Hz. This is what @tmuikku and @mabat are talking about.
This is a tweeter impulse response, and I have a reflection beginning at about 3 ms.
If I select the gate window so it does not include the reflection, I get this response
If I use a longer 4 ms window, I am now getting the reflection. If the time gate includes reflections, the frequency response is no longer quasi-anechoic.
We can clearly see the undulations from 500 - 5000 Hz. This is what @tmuikku and @mabat are talking about.
Yeah it would make sense its from the environment, gating issue.
Interference pattern has greater magnitude on low frequency, where directivity is lower. Also, combfiltering has dips and peaks at same frequencies on them all basically meaning secondary sound has same delay on all sweeps. Interference amplitude increases with off-axis angle so there is probably sidewall reflection, assuming its measured rotating dut horizontally keeping mic still, like usual. Perhaps another reflection with much shorter delay to make the peculiar interference pattern, perhaps stand the dut is on?
In general, converting IR to FR for crossover work the gating is critical and can lead even more errors than this. If real measured phase is to be preserved then all IR measurements need to be converted to FR with exact same gate to preserve the phase data. But also measurements need to be done with accurate distance ad rotation axis and so on
Thanks for posting those measurements, @Patrick Bateman. I struggle to grasp coverage and directivity index design goals. Will you please explain your thought process behind the coverage/DI choices you made in this design? For example, why did you choose to increasingly narrow coverage above 2,000Hz at the rate you narrowed it. Based on your Geddes reference I suspect you did it to create a specific type side wall reflection but I'm not sure if I understood that correctly.
Thanks
View attachment 1181925
For the most part, I just took Marcel's "Tritonia" waveguide and made some tweaks to it, so that it:
1) worked better with my dome tweeter
2) was more asymmetrical
There's a pretty good chance that I'll go with a five channel setup for my home theater. This means that I had to keep vertical height relatively short, but I have as much horizontal room as I could ever want. (My TV downstairs is a Samsung QN900A 85" and my setup upstairs is a Sony SXRD projector with a 120" screen.)
The end result was fairly close to the JBL 708P, which is well regarded. My speaker controls directivity down to 350Hz while the JBL peters out at 600hz:

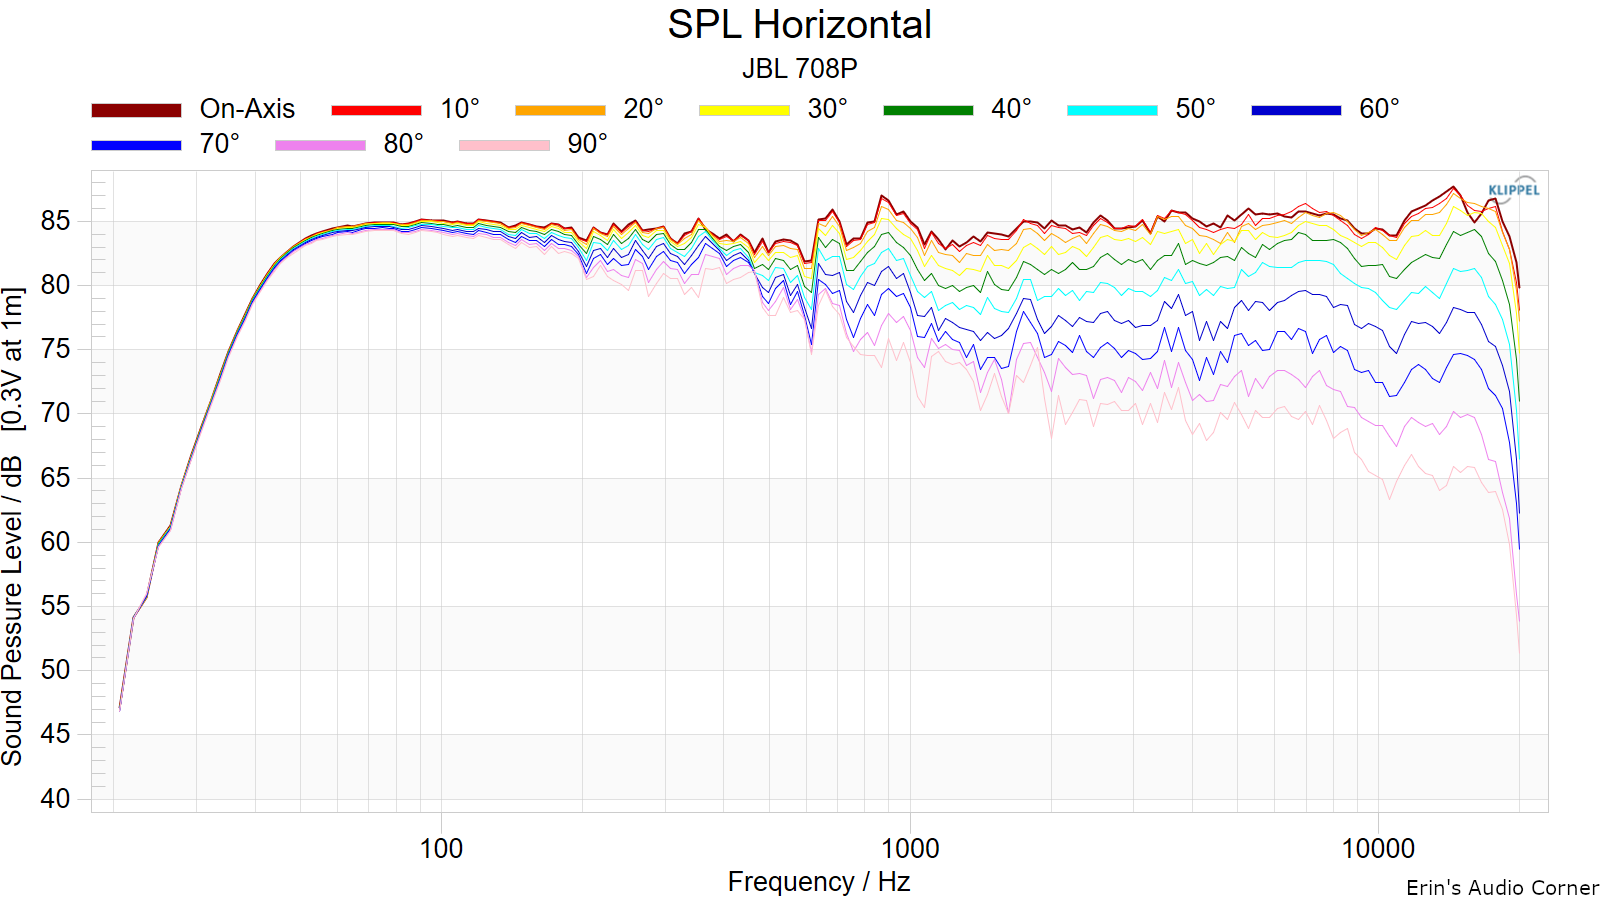
Note that my measurement is from zero to 45 degrees while Erin's is from zero to 90.
@Patrick Bateman, thanks for the explanation.
@hifijim, thanks for the gating example.
I corrected the gating on my earlier B&C DE111 measurement and made a new measurement for a B&C DE250. Same waveguide geometry but different 3D prints in addition to the physical difference in compression drivers. The gray material on the back of the DE250 waveguide is plumber's putty so I can easily remove the outer mouth termination and replace it with a different print. It's raining where I'm at so I'll remeasure outside when it dries up. IMO, the physical print of the DE250 is superior to the DE111. The DE111 waveguide is a little warped and wasn't assembled as well as the DE250 waveguide. I didn't expect the DE111 to perform better. I'm guessing the rear waveguide differences worked in the DE111's favor but I don't know enough to know. I think I'll figure out how to attach the DE111 to the DE250 waveguide and measure again to see what happens when it has a smaller sized compression driver attached.

This is the DE111 (small compression driver) measurements posted in #12,728 but now with corrected gating, Microphone at 2 meters.

This is the DE250 (larger compression driver) with the same gating used for the DE111 except the microphone is 1 meter closer.

@hifijim, thanks for the gating example.
I corrected the gating on my earlier B&C DE111 measurement and made a new measurement for a B&C DE250. Same waveguide geometry but different 3D prints in addition to the physical difference in compression drivers. The gray material on the back of the DE250 waveguide is plumber's putty so I can easily remove the outer mouth termination and replace it with a different print. It's raining where I'm at so I'll remeasure outside when it dries up. IMO, the physical print of the DE250 is superior to the DE111. The DE111 waveguide is a little warped and wasn't assembled as well as the DE250 waveguide. I didn't expect the DE111 to perform better. I'm guessing the rear waveguide differences worked in the DE111's favor but I don't know enough to know. I think I'll figure out how to attach the DE111 to the DE250 waveguide and measure again to see what happens when it has a smaller sized compression driver attached.
This is the DE111 (small compression driver) measurements posted in #12,728 but now with corrected gating, Microphone at 2 meters.
This is the DE250 (larger compression driver) with the same gating used for the DE111 except the microphone is 1 meter closer.
BTW, in the CircSym mode it's easy to manually add a driver body to the model, simply by moving the points in 'nodes.txt'.
Here I just quickly sketched something similar to a DE250 -


You see that the small midrange diffractions are due to the driver itself. Here it is relatively large compared to the waveguide.
Here I just quickly sketched something similar to a DE250 -
You see that the small midrange diffractions are due to the driver itself. Here it is relatively large compared to the waveguide.
Adding the driver to the simulation is a huge help. Thanks.
These are the differences in the waveguide configurations and the separate 3D print files.
These are the differences in the waveguide configurations and the separate 3D print files.
Throat.Ext.Angle = 0
Throat.Ext.Length = 22.5 (DE250); 10.75 (DE111)
R-OSSE = {
R = 101
a = 46
r0 = 9.5 (DE250); 9.0 (DE111)
a0 = 23
m = 0.76
r = 0.30
q = 3.65
k = 18.6
b = 0.0
arcterm = 160
}
Rot = 12
Attachments
- Home
- Loudspeakers
- Multi-Way
- Acoustic Horn Design – The Easy Way (Ath4)