How did you get to know the wavefront shape variations? Or what did you measure?i used to have a pile of DH1A diaphragms that said different.
It's both. For me a smooth calculated throat acoustic impedance and a smooth measured electrical impedance are both signs of a low level of reflected energy inside the device. I don't know how to measure acoustic impedance.
From the pressure measurements it's also clear that the level of diffraction is very low, which must also mean, IMHO, a low level of reflected energy back towards the throat.
From the pressure measurements it's also clear that the level of diffraction is very low, which must also mean, IMHO, a low level of reflected energy back towards the throat.
Last edited:
i do have to share that one thing that helped reduce the incidence of "shattered" diaphragm was application of latex caulk at the seam between of the driver/horn/waveguide and smoothed with a dowel, seemed to lessen the problem, so is it a false conclusion to think that the removal of a discontinuity prevented reflected energy?
could ATH be used as a failure analysis tool i.e. introduce an intentional discontinuity and compare to a real world model with the same fault for comparision?
could ATH be used as a failure analysis tool i.e. introduce an intentional discontinuity and compare to a real world model with the same fault for comparision?
Absolutely. Right now I'm working on version 4.7 supporting a circular symmetry mode of the BEM analysis where it's extremely easy to manually introduce any such thing even additionaly. It should be available in a few days.could ATH be used as a failure analysis tool i.e. introduce an intentional discontinuity and compare to a real world model with the same fault for comparision?
I have no clue but if I were to bet I would guess that none of those play a significant role at moderate listening levels. But we still know very little about HOM levels in actual waveguides - I'd like to isolate those in the simulations, already made some effort but nothing conclusive (that's still only the objective part - than there's the subjective part).
Last edited:
Speaking of throat wavefront shapes, here is an example - 15" waveguide, 1" throat.
1) Throat opening angle = 0°, directly driven by a flat wavefront:

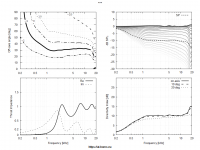
2) The same waveguide with the same throat but connected to a 30° conical section 20 mm long, emulating a compression driver's exit section (itself driven by a flat wavefront):

3) Connected to the same conical exit as before but now the throat opening angle is changed to match the connected conical section:

1) Throat opening angle = 0°, directly driven by a flat wavefront:
2) The same waveguide with the same throat but connected to a 30° conical section 20 mm long, emulating a compression driver's exit section (itself driven by a flat wavefront):
3) Connected to the same conical exit as before but now the throat opening angle is changed to match the connected conical section:
Attachments
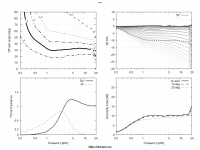
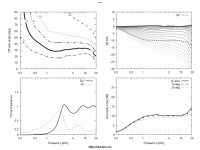
strangely enough from looking at the response curves i would think that the third iteration would sound smoothest overall....it exhibits the least rise in on axis response above 18k and by and large rolls off gradually above 15k regardless of angle. the first iteration shows a small peak(about 17 k) before a step rolloff. (peaks are generally more audible )
the second iteration shows a subsequent rising of response after 18k that gets worse over angle, doesn't that go counter to the theory of "directivity" in that the response rolloff smoothly and consistently over angle?
the second iteration shows a subsequent rising of response after 18k that gets worse over angle, doesn't that go counter to the theory of "directivity" in that the response rolloff smoothly and consistently over angle?
- Home
- Loudspeakers
- Multi-Way
- Acoustic Horn Design – The Easy Way (Ath4)