VituixCAD seems like an incredble tool.
I followed steps provided by @sheeple to import into VituixCAD - see this post
https://www.diyaudio.com/community/...-design-the-easy-way-ath4.338806/post-7189006
More to follow!


I followed steps provided by @sheeple to import into VituixCAD - see this post
https://www.diyaudio.com/community/...-design-the-easy-way-ath4.338806/post-7189006
More to follow!
Code:
; -------------------------------------------------------
; Enclosure Setting
; -------------------------------------------------------
Mesh.Enclosure = {
  Spacing = 20,20,20,344
  Depth = 275
  EdgeRadius = 18
  EdgeType = 1
  FrontResolution = 8,8,14,14
  BackResolution = 25,25,25,25
  LFSource.B = {
    Spacing = 25
    Radius = 135
    DrivingWeight = 1
    SID = 1
  }
}

; -------------------------------------------------------
; Measurement Settings
; -------------------------------------------------------
Mesh.VerticalOffset = 162.5

; -------------------------------------------------------
; Mesh Setting
; -------------------------------------------------------
Mesh.AngularSegments = 96
Mesh.LengthSegments = 20
Mesh.ThroatResolution = 2.5 ; [mm]
Mesh.InterfaceResolution = 7.0 ; [mm]
Mesh.InterfaceOffset = 5.0 ; [mm]
Mesh.ZMapPoints = 0.5,0.1,0.5,0.99
Mesh.SubdomainSlices =
Mesh.Quadrants = 14                     ; 1/2 symmetry

; -------------------------------------------------------
; ABEC Project Setting
; -------------------------------------------------------

ABEC.SimType = 2
ABEC.Abscissa = 1 ; 1=log | 2=linear
ABEC.f1 = 20 ; [Hz]
ABEC.f2 = 20000 ; [Hz]
ABEC.MeshFrequency = 1000
ABEC.NumFrequencies = 200

ABEC.Polars:SPL H T = {
  SID = 0
  MapAngleRange = 0,180,72
  Distance = 3
 }

 ABEC.Polars:SPL V T = {
  SID = 0
  MapAngleRange = 0,180,72
  Distance = 3
  Inclination = 270
 }

ABEC.Polars:SPL H W = {
  SID = 1
  MapAngleRange = 0,180,72
  Distance = 3
 }

 ABEC.Polars:SPL V W = {
  SID = 1
  MapAngleRange = 0,180,72
  Distance = 3
  Inclination = 270
 }

ABEC.Polars:SPL_H_T_nor= {
  SID = 0
  MapAngleRange = -180,180,72
  Distance = 3
  NormAngle = 0
    FRDExport = {
    NamePrefix = hor_tweeter
  }
}

ABEC.Polars:SPL_V_T_nor = {
  SID = 0
  MapAngleRange = -180,180,72
  Distance = 3
  Inclination = 270
  NormAngle = 0
    FRDExport = {
    NamePrefix = ver_tweeter
  }
}

ABEC.Polars:SPL_H_W_nor = {
  SID = 1
  MapAngleRange = -180,180,72
  Distance = 3
  NormAngle = 0
    FRDExport = {
    NamePrefix = hor_woofer
  }
}

ABEC.Polars:SPL_V_W_nor = {
  SID = 1
  MapAngleRange = -180,180,72
  Distance = 3
  NormAngle = 0
  Inclination = 270
    FRDExport = {
    NamePrefix = ver_woofer
  }
}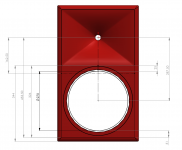
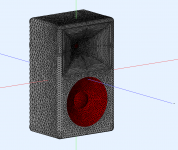
Fancy box time.
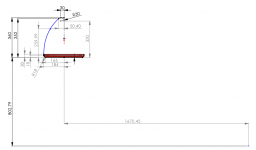
Can't quite get the plan to work. My points are wrong somewhere.

Can't quite get the plan to work. My points are wrong somewhere.
Code:
my_plan = {

  point  P0 166 0 8
  point  P1 184 18 8
  point  P2 184 30 20
  point  P3 50.4 352 20
  point  P4 30 360 20
  point  PB 0 360 20

  cpoint C1 166 18
  cpoint C2 0 260
  cpoint C3 30 330

  arc P0 C1 P1
  line P1 P2
  ellipse P2 C2 P3 P3  ;
  arc P3 C3 P4
  line P4 PB
}
Last edited:
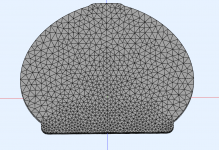
Still not quite right - @mabat if you have a moment can you take a look?
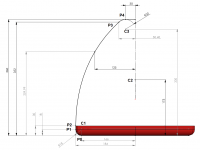
Code:
my_plan = {

  point  P0 166 0 8
  point  P1 184 18 8
  point  P2 184 30 20
  point  P3 50.4 352 20
  point  P4 30 360 20
  point  PB 0 360 20

  cpoint C1 166 18
  cpoint C2 0 173
  cpoint C3 30 330

  arc P0 C1 P1
  line P1 P2
  ellipse P2 C2 P3 P3
  arc P3 C3 P4
  line P4 PB
}

Last edited:
If there is only one observation point in the script then the Y values should be the same, as the off axis position of the woofer is embedded in the simulation.
If both drivers were simulated on their axis separately then the Y axis values would have to be used.
If the observation axis is the intended listening axis there is no change needed, if not then the Y axis of both drivers would need to be changed to reflect the offset.
If both drivers were simulated on their axis separately then the Y axis values would have to be used.
If the observation axis is the intended listening axis there is no change needed, if not then the Y axis of both drivers would need to be changed to reflect the offset.
I had not thought about shifting the results to intended listening axis, good point. limacon, think of it as if it was a real measurement: Y-offset is baked in into the data if you measure both drivers from one design axis. This is why you do not have to add it in this case. In my simulations, however, the acoustic axis was never precisely centered when I shifted the measurement axis via Mesh.VerticalOffest somewhere to the middle between both sources. Adding the same Y-offset to both sources to have VCad work from the acoustic axis might be beneficial then.
Thanks @fluid @sheeple
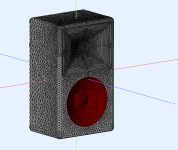
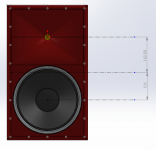
I am using the ATH4 script in https://www.diyaudio.com/community/threads/ath4-waveguide-inspired-multi-way.384410/post-7190965 so the measurement axis is middle of the cabinet, 3 meters away.
When I import to vcad should I set
tweeter Y + 162.5
woofer Y - 125.0
or should these both be zero?
I am using the ATH4 script in https://www.diyaudio.com/community/threads/ath4-waveguide-inspired-multi-way.384410/post-7190965 so the measurement axis is middle of the cabinet, 3 meters away.
When I import to vcad should I set
tweeter Y + 162.5
woofer Y - 125.0
or should these both be zero?


However, the Mesh.VerticalOffset in your script might not represent the actual acoustic axis. You will see this in VCad if the vertical pattern extends more into the plus ore minus degrees. If you entered a Y-offset of i.e. -10 mm for both tweeter and woofer, this shifts the listening axis accordingly.
I have measured the acoustic centre of the woofer and the CD in the baffle as per
https://audiojudgement.com/speaker-acoustic-center/
Is there anyway to amend the ATH4 woofer model to suit real world accordingly?
I’m trying a few different combinations of cabinet and minor changes to my waveguide shape. I’d like to make sure I’m comparing apples to apples, as it were.
https://audiojudgement.com/speaker-acoustic-center/
Is there anyway to amend the ATH4 woofer model to suit real world accordingly?
I’m trying a few different combinations of cabinet and minor changes to my waveguide shape. I’d like to make sure I’m comparing apples to apples, as it were.
This discussed in Ath thread when the feature was introduced. It is purely a model of dispersion characteristics, good enough to estimate how the system would perform in general. Rest is up to physical construction.
So, as I understand the default woofer model should be a sufficient model to inform what a cabinet is doing to dispersion. That’s fine by me. Onward cpu cycles.This discussed in Ath thread when the feature was introduced. It is purely a model of dispersion characteristics, good enough to estimate how the system would perform in general. Rest is up to physical construction.
Here is the fundamental idea: VituixCAD main window driver and its coordinates represents set of measurements loaded to that driver. Set of measurements could be from anything, from complete speaker or single driver/waveguide, or from simulation. VCAD sixpack graps show the response from observation point, listening distance away from 0,0,0 coordinates.Thanks @fluid @sheeple
I am using the ATH4 script in https://www.diyaudio.com/community/threads/ath4-waveguide-inspired-multi-way.384410/post-7190965 so the measurement axis is middle of the cabinet, 3 meters away.
When I import to vcad should I set
tweeter Y + 162.5
woofer Y - 125.0
or should these both be zero?
View attachment 1115881 View attachment 1115882
If you check out VCAD measurement manual it is recommended to measure each driver on axis, rotating the speaker around axis along the baffle which is common to all drivers. If done so the measurements are then shifted with the coordinates to represent reality. 0,0,0 point being the origin for the graphs, the listening axis (listening distance is set in options). Measurements can be real or from a simulation. It is operators responsibility to know how the measurements were taken and then adjust the coordinates so that their location would represent reality.
Its very late here so couldn't quite see your screenshots without my glasses on 🙂 but if you apply the measurement manual methodology in abec, set point of rotation on the baffle plane, center of each driver (and waveguide), then all you have to do in vcad is set the Y coordinates for each to represent reality (the 3d model). If listening height is at tweeter level then leave tweeter driver Y coordinate to zero and make woofer -260mm or something, what ever the c-c is in reality (in the 3D model).
The power here is that once you have this idea firmly in place, that the coordinates of a driver represent origin for the measurements its loaded with, and graphs show the combined response at observation point, then you can do what ever you want with VCAD. You can load it with ideal driver diffraction tool sims, abec sims, all kinds of real measurements, what ever you come up with measurements.
You could even adjust the coordinates to see "what if the coordinates were these instead", to figure out if some other 3D model could work even better, or some other listening height like standing up, and so on 🙂 Hope it helps
Last edited:
I do not see the advantage for Ath / ABEC simulations: Instead of fourteen hours of calculation time, limacon would need to run it twice, equalling 28 hours. Then, the resulting data is still representing one enclosure-driver topology, meaning that diffraction is baked into the FRDs anyway. Shifting axes in VCad seems more reasonable. What was the merit of running your CPU hot twice as long if you will still end up with the same model baked into your ideal frequency responses?
That doesn't need to happen, Observation script changes don't need a resolve of the BEM part, if you have a version that can save the project it is possible to go back and run different observations or LE scripts without resolving at any point. If it is a demo you need to do it before quitting.
The benefit of simulating the output on the drivers axis instead of from a single point is that Vituix is more accurate with that data if you want to see the effect of changes to x,y or z position.
Given that this is all some version of might be there is reasonable to make that it doesn't really matter 🙂
- Home
- Loudspeakers
- Multi-Way
- ATH4 waveguide inspired multi way
