Thanks for that paper. With the recent experiments I've been doing with wavelets, much of it even made sense ! Lol
Exploring observed negative group delay, asking how can that not defy causality and imply a transfer function operating faster than the speed of light, was downright philosophically interesting.
My thoughts exactly.
Speaking of wavelets, I came across an interesting post on ASR.
Last edited:
It is and I don't discount it
That said, as far as fairly simple domestic loudspeaker systems are concerned, I wouldn't lose any sleep over group delay.
It's different for complex installations and live sound.
This is the research paper that I quoted, it's not related to acoustics though.
Had you not left off the critical phrase "of the electromagnetic field." the quote would have made more sense, but then it would have made clear just how irrelevant the quote was to the discussion at hand.
First of all, I whole heartedly love Mr. King, most of us know who he is and what hes done. One of the things I appreciate about him is; for a person so smart, hes very patient...which makes sense, since, it takes patience for a person to make it anywhere in particular....ie very smart, very patient.... it goes together. Any way, here we go;
I decided to try and sum up my understanding of Group Delay, how it is calculated and what it means, using the results from a TL MathCad model. The modelled TL is a 5:1 tapered enclosure tuned to the driver's fs value, the driver is offset 1/3 of the length, and I have run the simulation empty and with 0.5 and 1.0 lb/ft^3 of fiber stuffing. I checked my empty results against the same geometry modeled in hornresp and they correlated as expected. A second order passive low pass crossover is applied at 700 Hz.
A TL and a BR enclosure are both 4th order systems, the combination of two resonant second order systems (driver and enclosure), so the phase shift passing through the tuning frequency is 360 degrees. A closed box is a second order system so the phase shift passing through the tuning frequency is only 180 degrees.
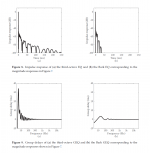
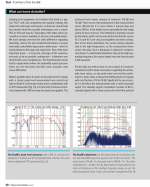
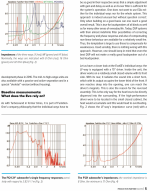
Below is a summary of the plotted results. The top two graphs are the magnitude and phase of the SPL frequency response and the bottom graph is the pressure time response. The frequency domain and time domain graphs are rigidly linked by the Fourier Transform, you cannot change one without changing the other. If you have results for one domain, you can quickly calculate the results for the other domain.
Understanding what these graphs are telling you is important. The top two are the SPL magnitude and phase in the frequency domain. The speaker is driven by a constant 2.828 volt source applied at the input terminals, the source has a phase of zero for all frequencies. The source is swept through the frequency range of interest, in this case 10 Hz to 10 kHz. The output is the SPL plots, the magnitude and phase relative to the input signal, calculated at a 1-meter distance. There is a theoretical 360-degree phase shift as the input signal sweeps through the tuning frequencies, typically between 10 and 100 Hz. The rate that this phase shift occurs with frequency is a function of the order of the speaker system and damping in the driver and the enclosure.
Taking the inverse FFT of the SPL magnitude and phase in the frequency domain produces the impulse response shown in the fourth plot, this is the sound pressure response in the time domain. The applied source impulse has a theoretical magnitude of 2.828 volts, the delay in the impulse response is due to the time of flight to the 1-meter distance. In the time trace you can also see inverted pulses occurring later in time. These are created by the original pulse leaving the back of the driver exciting waves in the TL enclosure that travel back and forth along the line’s length, these are reflections (echoes) that are not damped well by the empty TL enclosure.
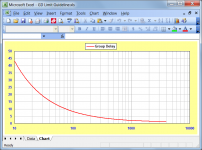
The third graph is the Group Delay. Group Delay is calculated by taking the negative of the derivative of the phase response, the second graph. In the second graph two curves are shown. The dashed line is the phase of the SPL magnitude at the standard 1 m distance, the solid line is the same result but with the frequency dependent shift created by the 1 m distance removed. I used the solid red line, the phase at the source, to calculate the Group Delay shown in the third graph. Using the other curve will change the group delay slightly, for each location in space a different group delay could be calculated, so I will stick with the source's phase. The ragged appearance above 100 Hz is caused by the standing wave resonances (local 180-degree phase shifts) typical of an unstuffed TL and are not important for this discussion.
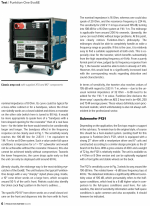
The maximum Group Delay is 23.61 msec at 25 Hz. From the top two plots the phase at 25 Hz is -134.47 deg, this is the phase difference between the applied voltage signal and the SPL response. The time associated with this phase is 14.94 msec since the period of a 25 Hz wave is 40 msec. The slope of the phase curve at 25 Hz is -0.02361 radians/radians/sec which when the negative sign is applied, and the units simplified, yields 23.61 msec. As you can see this result has nothing to do with time or time delay.

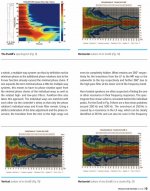
The four response plots are repeated below with 0.5 lb/ft^3 of stuffing added. In this case the Group Delay is calculated, and the maximum value is 17.73 msec at 19 Hz.

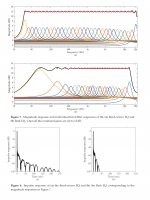
The four response plots are repeated below again with 1.0 lb/ft^3 of stuffing added. In this case the Group Delay is calculated, and the maximum value is 16.84 msec at 13 Hz.

Notice that the initial impulse response is essentially the same for all three TL simulations and only the “echoes” are changed by adding damping. Finally, some calculations are shown below for the time delay associated with the phase shift of the SPL output with respect to the voltage input at the frequency of the maximum Group Delay. In all cases the Group Delay does not have any physical meaning with respect to the time relationships between the input and output signals or the impulse response.

Group Delay is not a physical property of the speaker system. It is a derived metric that hints at the order and the damping in the system. There are claims that the audibility of Group Delay is frequency dependent, low frequencies being the least sensitive. I personally feel that Group Delay is a metric that adds no value, you are better off looking at the SPL response in the frequency domain and the impulse response in the time domain to assess the damping of a speaker system and if it is going to produce excessive ringing or booming in the bass frequencies or the other extreme an overdamped dry bass response. The calculated low frequency responses factoring in the room are probably even more important and informative. Associating any time or timing relationship to Group Delay seems to be misleading and not technically correct. Group Delay is only a measure of the slope of the phase curve which is a function of the system order and the internal damping, nothing more.
Had you not left off the critical phrase "of the electromagnetic field." the quote would have made more sense, but then it would have made clear just how irrelevant the quote was to the discussion at hand.
I did not explicitly suggest that the quote was relevant to acoustics, quite the contrary.
Neither did I leave out that critical phrase, since my quote was taken verbatim from the online article associated with the paper in question.
More specifically, the last paragraph (conclusions).
Still, it can sometimes be useful to venture off the beaten track.
Last edited:
Camplo
Everything that he is talking about is very LF. If you look at Brian Moore's work, he claims that our ear is maximally sensitive to group delay (GD) at 2-3 kHz. This is obvious since at those frequencies even small ms delay can mean nearly a period of delay. At LFs even large delays are only a fraction of a period. I don't worry about GD unless its above 700 Hz or so. Even then evidence is scant, but I am suspicious that GD's increase in audibility as SPL increases is a big factor in what we think of as "nonlinear distortion."
Everything that he is talking about is very LF. If you look at Brian Moore's work, he claims that our ear is maximally sensitive to group delay (GD) at 2-3 kHz. This is obvious since at those frequencies even small ms delay can mean nearly a period of delay. At LFs even large delays are only a fraction of a period. I don't worry about GD unless its above 700 Hz or so. Even then evidence is scant, but I am suspicious that GD's increase in audibility as SPL increases is a big factor in what we think of as "nonlinear distortion."
Hi David, thank you for that post.
It led me to search for the research behind the formula, and i found a paper of Mr Futtrup's where the formula is given on page 16. https://www.cfuttrup.com/blogspot/Book_05_Futtrup.pdf
What i found particularly interesting was info on page 15, quoted below, which sets the stage for the development of formula.
...............................................................................
"The audibility of Group Delay (GD) is studied in the general literature and in scientific papers [33,
34, 35, 36] without providing a clear picture. It shall be realized that a linear phase design will
result in constant GD, which provided the frequency response is linear becomes a time delay and
hence doesn’t affect the shape of the signal. It can therefore be concluded that any given reference
value for permissible GD is inherently flawed. As such, using for example the 30 ms limit as a
reference, based on a study of Echo Detection by Helmut Hass [33] requires that the reference value
is used under specific circumstances. Blauert and Laws [34] have studied the audibility of GD at
higher frequencies (500-8000 Hz). Again it must be stated that the found GD threshold values must
imply the use of a certain signal and other conditions, etc. (see the original paper [34] for details).
Instead it must be concluded that the phase distortion associated with GD can be audible, if it
changes quickly with frequency.
When studying in particular the bandwidth limited response of a loudspeaker, looking at the highpass response, applying the above found GD limits cannot be supported scientifically and must be
considered rather controversial.
Anyway, the author has extrapolated the measurements of Blauert and Laws and found a usable
curve that can serve as a guideline for Group Delay at lower frequencies, as shown in Fig. 7. The
curve reaches 30 ms at approximately 17 Hz, thus showing an apparent link between GD, echo
detection and lower audible limit frequency. The author is not an expert in psychoacoustics and
cannot assess whether this is a coincidence or whether such a relationship exists."
........................................................................................
The first two paragraphs appear to be very strong disclaimers about assuming Group Delay audibility has been scientifically established.
Followed by his let's do it "Anyway" paragraph.....(bold emphasis added by me)
Last sentence says it all, imo.
While I've heard this before, is there a new paper on the matter? or is it as simple as seeing a (possible) connection between the non-linear audibility of delayed secondary sources, and group delay due to apparent similarities?
I would state it as: "a (possible) connection between the non-linear audibility ..." of "group delay" and our perception of nonlinear distortion.
Audio equalizers with neural gain control.
Hi Ro,
Wow, that is a lot of science/work just to make a better graphic equalizer !!!!! Lol
Not sure how it fits in with group delay though ??
You know, what confuses me most about group delay, is not the terminology or the science, it's is why do folks let it get so complicated.
It's stupid simple imnsho. When phase changes quickly, we call it group delay.
And then debate like 400 hells as to when the rapid phase change becomes audible.
Or debate if it's even audible......
..... all the while being in near universal agreement that high-order IIR crossovers, high-Q EQ's, higher-order acoustical bandpass designs...all sound less than really good.
Wonder what those not so great sounding things all have in common?
Couldn't possibly be simple rapid phase change, huh?

Just flatten mag and phase and forget all the group delay crappola

I was lucky in that the pioneers only taught me to pay attention to impedance, phase, frequency, impulse, responses, so wasn't exposed to GD till I joined the more advanced forums, which convinced me it was 'much ado about nothing' for basic speaker design.
Funny, but true
I was born lucky with a lack of mellon power i guess, in that I'm one of those guys always looking to simplify (as opposed to complicate).
Why bother with the more complicated measurements, when the way to fixed complicated is by adjusting the simple measurements, in the exact same fashion as if complicated didn't even exist..
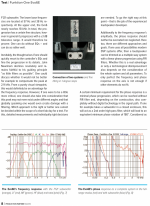
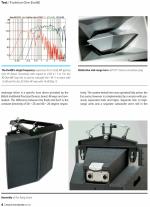
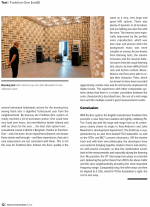
In the light of simplification and harking back to a brand discussed earlier, here's a review from a reputable German pro audio magazine that I came across recently. It is not a pure 2-way system, but a mid / high horn top (the core) with 1 or 2 segments for bass reproduction.
Attachments
-
 page11.png808.4 KB · Views: 80
 -
 page10.png668.3 KB · Views: 94
 -
 page9.jpg139.1 KB · Views: 100
 -
 page8.png719.4 KB · Views: 100
 -
 page7.png737 KB · Views: 87
 -
 page6.png768.9 KB · Views: 96
 -
 page5.png732.8 KB · Views: 224
 -
 page4.png824.2 KB · Views: 224
 -
 page3.png965.7 KB · Views: 229
 -
 page12.png740.3 KB · Views: 92
Last edited:
From previous discussions I remember the criticism of the mid / high sections of Funktion-One. Large cones - 10" in this case, are used far beyond 4kHz at very high output levels.
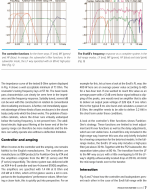
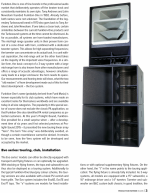
The measurements show that precisely the mid-high section has low distortion, even though the (suspected) break-up peak is visible.
I am familiar with the mid-high section (Evo-6SH) of the tested system.
It's part of a 4-point horn loaded clubsystem consisting of 2x EVO-6SH - 10″/1.4″ mid-high + F215mk2 - 2 × 15″ low in each corner and a (stacked) subhorn with 4x F221, double 21″.
Though I'm not a Funktion One fanboy - having experienced more than a few mediocre to plain awful installations, this particular system is without doubt among the best clubs systems in my country.
And if I had to choose, I would prefer this system's sound signature to most club systems I know (quite a few).
The midrange in particular is unmatched, which should come as no surprise given the lack of a crossover point.
An example of a fairly simple speaker system that may not be perfect, but nevertheless works very well.
Attachments


Last edited:
What about phase then...I know some about phase but when it relates to diaphragm position I'm clueless... If the phase response shows -90 at 200hz, what does that even mean....I know what it means as opposed to 0 degrees phase...but...the woofer cannot travel back in time...so for it to reach into the negative it must have pattern flipped at some point...which I just realized not all pattern flips happen at 180degrees....non the less...sticking to the example....-90 @ 200hz....so the woofer doesn't move until the initial tracking started at 0 degrees reaches -90? or the woofer does not create its measured spl pressure wave until 270 degrees (180 then pattern flip add 90 more) past 0?
Last edited:
- Home
- Loudspeakers
- Multi-Way
- Is it possible to cover the whole spectrum, high SPL, low distortion with a 2-way?