Nice precise cuts...
you have guts committing to such a project!!
Happy for you to be so involved again...and taking the lines to their potential.
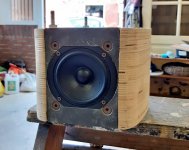
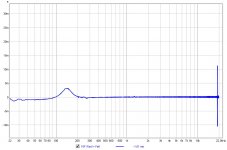
Impedance tests of the 2 10F's I received...
I measured both drivers in free air and in my test enclosure...
It resulted in these graphs:
This will come in handy for the filter simulations.
how does this compare to the previous speakers?
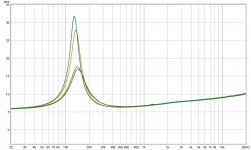
There are differences between impedance plots:

As seen in the Empty box plot, the 10F still shows one of the box modes despite the damping material used. I think it might be the holes to adjacent chambers, as I did not damp all of those during this test. I left out some felt pads as I had re-used those in the arrays. Will have to rerun the test while using felt in all the holes (as used in the array).
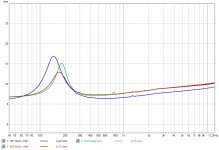
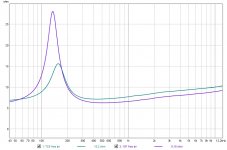
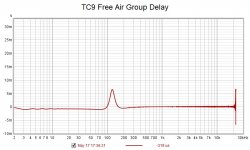
Of interest to me is looking at Group Delay of an impedance plot:

vs

Ignore the spike at 19K, that's my ancient laptop messing with things...
I can't draw any conclusions here, though one can see it in the impulse measurement as well. To me it looks like the difference between a well controlled and tight motor and one that is moving a bit more freely. But that's pure speculation on my part.
As seen in the Empty box plot, the 10F still shows one of the box modes despite the damping material used. I think it might be the holes to adjacent chambers, as I did not damp all of those during this test. I left out some felt pads as I had re-used those in the arrays. Will have to rerun the test while using felt in all the holes (as used in the array).
Of interest to me is looking at Group Delay of an impedance plot:
vs
Ignore the spike at 19K, that's my ancient laptop messing with things...
I can't draw any conclusions here, though one can see it in the impulse measurement as well. To me it looks like the difference between a well controlled and tight motor and one that is moving a bit more freely. But that's pure speculation on my part.
Attachments
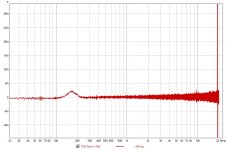
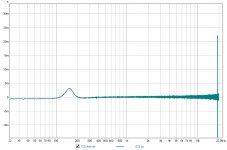
I don't know about what you see in the impulse but the TC9 impedance measurement there has a lot of noise in it. I don't think you can compare than at that level of detail. Using a decent headphone amp as a driving source helps, but your 10F measurement looks fine and I assume the TC9 is an old one.Of interest to me is looking at Group Delay of an impedance plot:
I can't draw any conclusions here, though one can see it in the impulse measurement as well.
I don't know about what you see in the impulse but the TC9 impedance measurement there has a lot of noise in it. I don't think you can compare than at that level of detail. Using a decent headphone amp as a driving source helps, but your 10F measurement looks fine and I assume the TC9 is an old one.
Done with exactly the same equipment. Just look at your own group delay tab of a TC9 measurements and compare it to a 10F. This isn't the first time I've mentioned it in this thread. Remember my conjugation network experiments?
In other words, a comparison done under similar/the same conditions.
Last edited:
In box comparisons don't say much.
Just compare free air results.
Since you have many it would be interesting to measure the whole batch, to get a good sense of tolerances.
I will, the 10F batch isn't here yet, just two drivers to play with (sold as a pair).
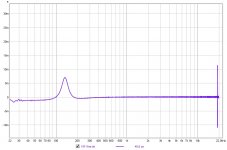
I do find in box measurements interesting as it does show internal resonances. Every blip in an impedance measurement could lead to a frequency plot deviation.
Yes, it mostly shows the internal resonances, but you first also need to know the resonances of the driver itself.
For internal resonances I would use impedance, nearfield freq resp as well as a (nearfield) burst decay (waterfall in periods, I use ARTA, don't know the equivalent in REW)
For internal resonances I would use impedance, nearfield freq resp as well as a (nearfield) burst decay (waterfall in periods, I use ARTA, don't know the equivalent in REW)
Just look at your own group delay tab of a TC9 measurements and compare it to a 10F.
My TC9 looks like your 10F one less noisy
Attachments
REW now has a burst decay mode in the spectrogram much the same as ARTAFor internal resonances I would use impedance, nearfield freq resp as well as a (nearfield) burst decay (waterfall in periods, I use ARTA, don't know the equivalent in REW)
REW now has a burst decay mode in the spectrogram much the same as ARTA
Nice, it still doesn't want me to use REW

But as long as they use the right methods, results can be compared.
So to each their own.
My TC9 looks like your 10F one less noisy
Now go out and get a 10F and show what that does
.I use a simple laptop on board soundcard here, but it does show trends between the two drivers...
Here's way more on that same subject: https://www.diyaudio.com/forums/full-range/242171-towers-25-driver-range-line-array-135.html#post4433310
Never really did figure out the why, but right now it's different between 10F and TC9, that's for sure.
Could I make the graphs of the TC9 look better? Sure, by using a small amplifier. But there would still be that difference between the TC9 and 10F.
The 10F would look even cleaner. Just like using a series resistor with the TC9 array in the link I posted.
- Home
- Loudspeakers
- Full Range
- The making of: The Two Towers (a 25 driver Full Range line array)