Popup diffracgion tool from the tools menu, input 200 x 400mm panel, 220 sd for 8" ideal driver, hit new and move the driver to a plausible position on the baffle, move the mic center of the driver. Check "feed driver" and hit "export". Now add second driver in the simulator main window drivers tab as tweeter, go back to diffraction tool window, enter 25mm for driver diameter, move it to a position as well as the mic, hit "feed driver".
After few experiments this all takes about 20 seconds
As the drivers were measured the mic at their center, remember to input Y-coordinate for the woofer.
Hope it helps!
After few experiments this all takes about 20 seconds
As the drivers were measured the mic at their center, remember to input Y-coordinate for the woofer.
Hope it helps!
Last edited:
Rockport cabs and copies seem to have roughly 60deg angle to side panel and 45 to top. I really much would like to see hi-res directivity mesasurements of them, I believe that angle is too steep. Anyway, Avior II measures pretty well!
https://www.stereophile.com/content/rockport-technologies-avior-ii-loudspeaker-measurements
Stepped angles by hifijim on the other hand seem to work very well, as expected really.
https://www.stereophile.com/content/rockport-technologies-avior-ii-loudspeaker-measurements
Stepped angles by hifijim on the other hand seem to work very well, as expected really.
I think it might partly be an optical illusion as the bevels are rounded and are really deep in both directions, the baffle is tilted too. They are less steep around the tweeter and mid where it counts but in the bigger speakers they drop off pretty fast around the woofers.Rockport cabs and copies seem to have roughly 60deg angle to side panel and 45 to top.
Here's an early use of simulation to design a famous large scale PA system. Saw it over at Prosound web.
Thought you guys might find it interesting.....
https://www.paoftheday.com/showco-prism-sound-system/
Thought you guys might find it interesting.....
https://www.paoftheday.com/showco-prism-sound-system/
I am going to continue experimenting with other simulation shapes to see if I can get a better match to reality...
After a couple of days of simulating with a variety of diffraction shapes, including various trapezoids, I conclude that a simple box with the appropriate edge radius is the best simulation for this beveled/faceted baffle shape.
j.
Attachments
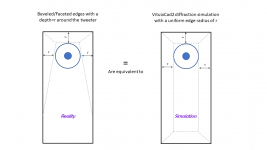
Hi Jim, the meaning of those words eludes me. Could you please rephrase it?...a simple box with the appropriate edge radius is the best simulation for this beveled/faceted baffle shape.
j.
(ie, do you mean "a simple box with the appropriate edge radius" has the same acoustic function as "this beveled/faceted baffle shape"? if so, what is "a simple box with the appropriate edge radius"? Or do you refer to VituixCad simulation capabilities?)
Hi Jim, the meaning of those words eludes me. Could you please rephrase it?
(ie, do you mean "a simple box with the appropriate edge radius" has the same acoustic function as "this beveled/faceted baffle shape"? if so, what is "a simple box with the appropriate edge radius"? Or do you refer to VituixCad simulation capabilities?)
Never mind, I should have opened the image file before posting.After a couple of days of simulating with a variety of diffraction shapes, including various trapezoids, I conclude that a simple box with the appropriate edge radius is the best simulation for this beveled/faceted baffle shape.
j.
🙏I want to leave something here, maybe someone will verify or disprove. I do not know, if it holds reality beyond my simulation data.
I had exported some simulations of a waveguide from VCAS today, that I had prepared using mabat's ath. I wanted to check Directivity index in VCad, and I found that it was a real controlled directivity device, maybe a bit on the bright side (I am a hot mess!). Also, I wanted to check continuity in crossover region. After all, I had gone for an asymmetric waveguide, so that I could increase center to center distance to 1 lambda on my baffle, after kimmos now well known formula, which he had explained on an LR4 basis. I created data for the woofer from a chart of PHL 3411, pulled it through diffraction tool and began.

Although LR4 was okayish, it did not fully satisfy me and I began browsing through other crossover typologies. Some combinations weren't possible, as my HF compression driver would not really play them, such that I was limited to steeper high pass filter. I found two interesting combinations, having in mind a continuous directivity chart.
Butterworth HP 3rd order, LP 2nd order, at 1.3k:
.png")


Waterfall is with reference axis at 15 deg, set to 0 deg you can see what is happening:
_Ref.png")
Bessel HP 4th order at 1.4k, LR2 LP 2nd order at 1.1k, with some small PEQ to improve summation:
_2.png")


I however could not recreate these results with some real world measurements of other drivers, despite my best effort.
I had exported some simulations of a waveguide from VCAS today, that I had prepared using mabat's ath. I wanted to check Directivity index in VCad, and I found that it was a real controlled directivity device, maybe a bit on the bright side (I am a hot mess!). Also, I wanted to check continuity in crossover region. After all, I had gone for an asymmetric waveguide, so that I could increase center to center distance to 1 lambda on my baffle, after kimmos now well known formula, which he had explained on an LR4 basis. I created data for the woofer from a chart of PHL 3411, pulled it through diffraction tool and began.
Although LR4 was okayish, it did not fully satisfy me and I began browsing through other crossover typologies. Some combinations weren't possible, as my HF compression driver would not really play them, such that I was limited to steeper high pass filter. I found two interesting combinations, having in mind a continuous directivity chart.
Butterworth HP 3rd order, LP 2nd order, at 1.3k:
Waterfall is with reference axis at 15 deg, set to 0 deg you can see what is happening:
Bessel HP 4th order at 1.4k, LR2 LP 2nd order at 1.1k, with some small PEQ to improve summation:
I however could not recreate these results with some real world measurements of other drivers, despite my best effort.
The obvious thing, easier said than done so kudos if you do it, is to take/measure a set of polars and compare measured phase to simulated phase....Yes, I was assuming this, that maybe phase was the factor why I couldn’t achieve the same results with measured data. Too bad.
hmm, which rises a question for waveguides, how the depth is related to wavelenght? I'd bet that <1/4 wl deep device at crossover frequency (which is related to mouth size) yields nicer graphs for the whole system than >1/2 wl deep. But depth relation to mouth size also affects directivity so perhaps this is something that is not very relevant, as we might want different directivity regardless. Need to test it at some point somehow just because it is interesting
It does not exist outside of the simulation yet.The obvious thing, easier said than done so kudos if you do it, is to take/measure a set of polars and compare measured phase to simulated phase....
Why should that be so? The wavefront extends from the mouth of the waveguide, not the throat.hmm, which rises a question for waveguides, how the depth is related to wavelenght? I'd bet that <1/4 wl deep device at crossover frequency (which is related to mouth size) yields nicer graphs for the whole system than >1/2 wl deep. But depth relation to mouth size also affects directivity so perhaps this is something that is not very relevant, as we might want different directivity regardless. Need to test it at some point somehow just because it is interesting
^ Looking at the graphs you posted got me thinking. Look at the deep nulls behind at crossover, this only happens when the two woofer and waveguide are opposite phase to that direction. This could also happen if either was playing alone and the other didn't affect (or was like 20db quiteter), but I don't think this is possible at crossover unless either is way bigger than the other shadowing the back more especially you mention these are both on same enclosure. While this particular case might be just the ideal measurements without proper phase data that makes the response so, but something similar is seen in my system measurements as well.
Anyway, gotta test it out and think about it for a while. Not sure if there is anything too important here, just very interesting phenomenon involving wavelength and need to figure out whats going on Here is quick test on a prototype speaker where cardioidish mid and waveguide xo is about 1.1kHz and delay on the mid driver is varied. The delay with this particular crossover can be roughly 0.25 - 0.45ms without too much difference on the on axis response, this is roughly 1/4wl adjustment range, 1.1kHz is roughly ~0.9ms and 1/4 of it is about 0.2ms.
Anyway, the adjustment affects quite significantly off-axis and almost nothing happens on-axis so clearly something is going on. Either it is due to diffraction or small difference in directivity of the devices or on the mouth vs. cone size or something, that makes the delay effect more off-axis than on-axis. Anyway, in this case there is no meaningful difference on-axis but at the back sector > 130degrees there is up to -6db more attenuation around crossover frequency! Although the response is down quite much to the back like in your example, the difference here is probably not audible on listening position. Still very interesting


Anyway, gotta test it out and think about it for a while. Not sure if there is anything too important here, just very interesting phenomenon involving wavelength and need to figure out whats going on
Here is quick test on a prototype speaker where cardioidish mid and waveguide xo is about 1.1kHz and delay on the mid driver is varied. The delay with this particular crossover can be roughly 0.25 - 0.45ms without too much difference on the on axis response, this is roughly 1/4wl adjustment range, 1.1kHz is roughly ~0.9ms and 1/4 of it is about 0.2ms.Anyway, the adjustment affects quite significantly off-axis and almost nothing happens on-axis so clearly something is going on. Either it is due to diffraction or small difference in directivity of the devices or on the mouth vs. cone size or something, that makes the delay effect more off-axis than on-axis. Anyway, in this case there is no meaningful difference on-axis but at the back sector > 130degrees there is up to -6db more attenuation around crossover frequency! Although the response is down quite much to the back like in your example, the difference here is probably not audible on listening position. Still very interesting
Last edited:
Played around with the sims above trying to figure out what is going on. I think it is most likely how the system was measured, where the rotation axis is. I measured with rotation axis at mouth (baffle) plane and I believe this is what the default ATH generated ABEC project also does?
Increasing delay on the mid driver in simulation is not moving the mid and producing new measurements but the whole set of measurements is delayed, to all directions. For this reason I just consider the back radiation not reliable, and not relevant. Any thoughts? Perhaps try with Z offset at some point.
Increasing delay on the mid driver in simulation is not moving the mid and producing new measurements but the whole set of measurements is delayed, to all directions. For this reason I just consider the back radiation not reliable, and not relevant. Any thoughts?
Perhaps try with Z offset at some point.Meanwhile posted some sims and thoughts on "Kimmosto c-c rule" on augerpro waveguide thread as it came to discussion there. https://www.diyaudio.com/community/...uides-for-cnc-3d-printing.318190/post-6990719 An experiment whose intention was to figure out if increased c-c works for all situations or just some specific ones as the whole concept has to do with first reflections and angles, which depend on how a system is setup in a room. I have reported to mods and asked to move the posts in this thread instead, so perhaps it is all readable below soon?
Little bit imagination and experimenting with some helpful tools can make long way even though there is no sound on such experiments to actually evaluate what is better or is there meaningful difference they still are helpful to expand thoughts and vision for future experiments and builds. Trying to share as much as I can even if it wasn't always relevant to all or very well formatted. Hopefully the message is not too scrambled/hard to read so that others get their imagination running as well, to help piecing together their systems. I like to think that eventually various concepts knit together nicely on design table making good balanced compromise system. Thinking wavelenght as key to everything opened my imagination.
even though there is no sound on such experiments to actually evaluate what is better or is there meaningful difference they still are helpful to expand thoughts and vision for future experiments and builds. Trying to share as much as I can even if it wasn't always relevant to all or very well formatted. Hopefully the message is not too scrambled/hard to read so that others get their imagination running as well, to help piecing together their systems. I like to think that eventually various concepts knit together nicely on design table making good balanced compromise system. Thinking wavelenght as key to everything opened my imagination.Vcad uses this for the baffle sim:can it be simulated in VituixCad?
"
The Distributed Edge Dipole (DED) Model for Cabinet Diffraction Effects
https://www.aes.org/e-lib/online/browse.cfm?elib=13024It is a free paper.
The short answer is, yes and no. Can you simulate what happens when drivers are not on the same axis? Yes. The baffle sim is meant for flat shapes with the edge radius like a gain on the shape.
So you could make a fuzzy sim of sorts.
- Home
- Loudspeakers
- Multi-Way
- VituixCad Simulations with Ideal Drivers