Easier for me to do everything for 180 deg twice in this big puzzle and just divide two weighting factors by 2.
Just to be sure I get this right:
- your coefficient for 0°/0° is (approximately) 0.0004758 / 2 = 0.0002379
- your coefficient for 180°/180° is (approximately) 0.0004758 / 2 / 2 = 0.00011895
This means that the sum in your code includes the 0°/0° point twice, and the 180°/180° point is included four times for some reason.
Correct?
Ok, so I tried the Tylka calculation using your coefficient values from post 1177. To this end I first tried with 0.000237... for the last coefficient for the 180° point, and then I also repeated with 0.000118... . Both results were very close to the one with the original Tylka calculation (less than 0.1 dB difference everywhere). This is not surprising, as your coefficient values are essentially identical to the Tylka values.
This means that although my Tylka code and Vituix use the same coefficients, the result is not the same. Therefore Vituix and my Tylka code therefore don't implement the same calculation. I attached the formula I used for the Tylka calculation. How is this different from the Vituix calculation?
Note: the w_n correspond to the coefficients as discussed in post 1177.
Attachments

How is this different from the Vituix calculation?
No difference - except 10log(4pi) offset in total.
PS1. Just want to make sure that you calculate VCAD results with the main program - not with Calculator tool which uses the simplest weighting with sin() function i.e. 0 deg and 180 are totally ignored.
PS2. The latest built of 2.0.15.3 (downloadable since yesterday evening) uses Archimedes' hat-box theorem cos(a)-cos(b) for area calculation. Difference to old versions such as obsolete 1.1 is insignificant, visually undetectable with default dB scale.
PS2. The latest built of 2.0.15.3 (downloadable since yesterday evening) uses Archimedes' hat-box theorem cos(a)-cos(b) for area calculation. Difference to old versions such as obsolete 1.1 is insignificant, visually undetectable with default dB scale.
Difference between simple sin() and area (or integral of sin) weighting is quite small if angle interval is only 5 deg:
In practice, amount of off-axis angle measurements is the most significant factor in addition to limit of dual planes only. Curve fitting would work better than weighting by sector factors but that would reduce calculation performance.
An externally hosted image should be here but it was not working when we last tested it.
In practice, amount of off-axis angle measurements is the most significant factor in addition to limit of dual planes only. Curve fitting would work better than weighting by sector factors but that would reduce calculation performance.
No difference - except 10log(4pi) offset in total.
Alright, so now at least I know the formula used in Vituix. So the "How does it work?" question is now settled. 😀😀😀
With respect to the question "Is the result correct?", here are some updates:
PS1. Just want to make sure that you calculate VCAD results with the main program - not with Calculator tool
Yes, I used the main program.
There is some progress on my side. In my code, I screwed up the allocation of the data files to the corresponding H_m,n terms where the angles wrapped around the hemispheres (i.e., at the rear of the speaker). The Vituix convention is slightly different to what Tylka uses, and I got confused by this. While the w_n coefficients were right all the time, they were not always multiplied with the correct SPL curves (H_m,n terms). I fixed this now.
I have also tested my code by artificially setting all H_m,n to zero with the exception of one (n=k), which was set to 1:
- H_m,n = 1 for n = k
- H_m,n = 0 for all other n
By looking at the summation (see post 1183) you will find that whatever the choice of k is, the resulting power response (before conversion to dB) will be equal to 2 x w_k. Implementing this in the code is easy, and I have done this test for all possible k values (with a 5° angle step, there are 72 possibilities). The code always gave the correct result. I am therefore quite confident that it works correctly now.
The power response curve from the fixed code is now closer to the Vituix curve than before, but there is still some discrepancy of almost 1.5 dB above 10 kHz (see attached plot). I don't know if this is just a difference related to the numerical techniques, or if it's something more conceptual.
Attachments

Alright, so now at least I know the formula used in Vituix. So the "How does it work?" question is now settled. 😀😀😀
That basic part was already explained 3 days ago and exception logic for weighting factors 2 days ago. But I guess Greek hieroglyphs suit better than my bad English flavored with minor amnesia. I'm done with this item.
Rev. 2.0.15.4 (2019-05-05)
Diffraction
* Effect of Floor and Wall boundary reflections reprogrammed.
New calculation method enables easy adding of new boundaries such as front wall and ceiling, which might be added later.
Enclosure
* Added name and Vd[cm3] read-only text boxes to Driver configuration group. Name saved to user settings and enclosure project file.
* Added name and Vd[cm3] read-only text boxes to Passive group. Name saved to user settings and enclosure project file.
Hi Kimmosto:
Regarding front wall and ceiling reflections, I would love to see them. I immediately tried out the new revision but the changes apparently aren't apparent to the user.
As you may recall I tried simulating them for a line array via image method in the main program but there were multiple issues that you noted causing me to abandon that approach. But floor and ceiling reflections are critical to line array performance in a home environment so I have gone as far as I can with them in the current program and would appreciate your help going further. The goals are not just to understand line array behavior but to be able to develop shading coefficients without endless cut and try or audible in-living-room tweaking.
Any improvement to the accuracy of these sims is welcome but especially if it would shed light on why the comb filtering seen in simulations of line arrays is usually worse than seen in measurements.
Looking at geometry of a 2m tall line array, one needs high resolution vertical directivity only within 0 to 27 degrees for the main array and its ground reflection or out to 37 degrees if including a ceiling reflection. Diffraction tool only goes down to 5 degrees but I am able to import piston directivity from HornResp down to 1 degree. It would be nice if diffraction tool would do this for me as that takes some time. Its not practical for me to do 1 degree measurements but next time out I will get down to 5 degrees in this critical region. I wonder if there is a way to interpolate between 5 or 10 degree measurement data in some external tool then import or if that feature could be added to calculator.
Now I'm adding ground reflection in main program by the simple expedient of adding 2x number of drivers. This puts the vertical axis on the floor, which is not ideal, but it does give me answers. I can't add ceiling reflection this way because baffle height seems to be limited to 2m. If you would raise that limit (3m would be sufficient) then I could add the ceiling reflection. Simulation performance is not yet an issue. There is a lag to recompute but only a few seconds.
Looking at reflections in diffraction tool is certainly easier. In the main program there is more flexibility to add frequency dependent reflection coefficients in an attempt to correlate with measurements. I will shortly be able to do measurements of a full line array so this will be interesting.
Thanks,
Jack
First Loudspeaker XO
I am coming at this as a former consumer who had very little knowledge of what a loudspeaker actually was. 4 years ago I threw out all I thought I knew and simply asked the question; "What is a loudspeaker". Many books, articles and debates later, here I am with my first loudspeaker and XO design using everything I have learned so far. Ofc, this is still on a theoretical level since I need to prototype the loudspeaker and it is in regards to this that I have a question.
To does who are using Vituix and have done all the theoretical and simulation before actually building. Compared to the simulation using in part SPL Trace (for midrange and tweeter) and the cabinet tool for woofer total SPL ... What is your experience in terms of frequency and XO response when you measure the raw driver response in the cabinet and use does frd files - Is the simulation close or do you need to redo the XO ???
Oneminde
Attachments

Last edited:
If you are getting the FRD curves by SPL tracing from published data, they will not match the SPL from measuring the driver in a cabinet using a mic, because baffle response will impact the SPL, and for low frequency drivers, the low frequency response may be impacted by the box (depending on how low your mic measurements go).... Compared to the simulation using in part SPL Trace (for midrange and tweeter) and the cabinet tool for woofer total SPL ... What is your experience in terms of frequency and XO response when you measure the raw driver response in the cabinet and use does frd files - Is the simulation close or do you need to redo the XO ???...
There are documented ways to get the published SPL by SPL tracing and then remove the baffle effects by using spreadsheets from the FRD Consortium. I haven't done those for any of my projects. I just look at the published SPL and build the box, and take the risk that my box-mounted measured SPL will be close enough to what I saw in the datasheets to let me build a decent xo.
Regarding front wall and ceiling reflections, I would love to see them.
Here you are.
Rev. 2.0.16.0 (2019-05-06)
Main program
* Added curve with boundary reflections to Power & DI chart. Listening window average is hidden while reflection curve is visible.
* Added Side wall, Front wall, Floor and Ceiling enabling checkboxes and distance text boxes to Drivers tab to control calculation of boundary reflections.
* Added Absorption text box to Drivers tab for boundary reflections.
* Added File->Export->Reflection response.
Diffraction
* Minimum angle step for directivity export reduced from 5 to 1 degrees.
Awesome! Your post arrived with my morning coffee!
What exactly is the boundary reflection? Is it the power response when reflections are enabled or is it the SPL recorded at the reference angle or? Assuming the latter, I tried to mirror it flat via calculator and that didn't work...
What exactly is the boundary reflection? Is it the power response when reflections are enabled or is it the SPL recorded at the reference angle or? Assuming the latter, I tried to mirror it flat via calculator and that didn't work...
What exactly is the boundary reflection?
Result is frequency response with reflections at virtual listening point.
Distance from drivers origin to listening point specified in Options window (Listening distance). Speaker rotated so that direction to listening position is to Reference angle.
Result is frequency response with reflections at virtual listening point.
Distance from drivers origin to listening point specified in Options window (Listening distance). Speaker rotated so that direction to listening position is to Reference angle.
That is what I thought. I'll have to take another look at mirror filter calculation.
My speaker is going to be toed in. Without boundary reflection, I didn't enter the driver rotation via driver layout table. If I do that now , will it be taken into account in the boundary reflection calculation? The 45 degree toe in is pretty significant at HF.
Using 1 degree diffraction directivity makes a real difference in directivity charts! Might not be more accurate as not based on measurements but line charts are prettier and indicate significantly less response variation in vertical plane.
If I do that now , will it be taken into account in the boundary reflection calculation?
Yes - assuming that I understand your message 🙂
Anyway, calculation is very simple mirroring. For example floor reflection is sum of individual driver responses towards virtual point at distance sqrt(listening_distance^2 + (2*floor_distance)^2). That sum is attenuated with common absorption gain and summed to direct axial response at listening distance. Both sum responses (axial and reflection) include effects of speaker turning with Reference angle [deg] and individual driver horizontal rotation R [deg] and vertical tilt T [deg].
Its worth a picture to clarify and I hope my picture does that
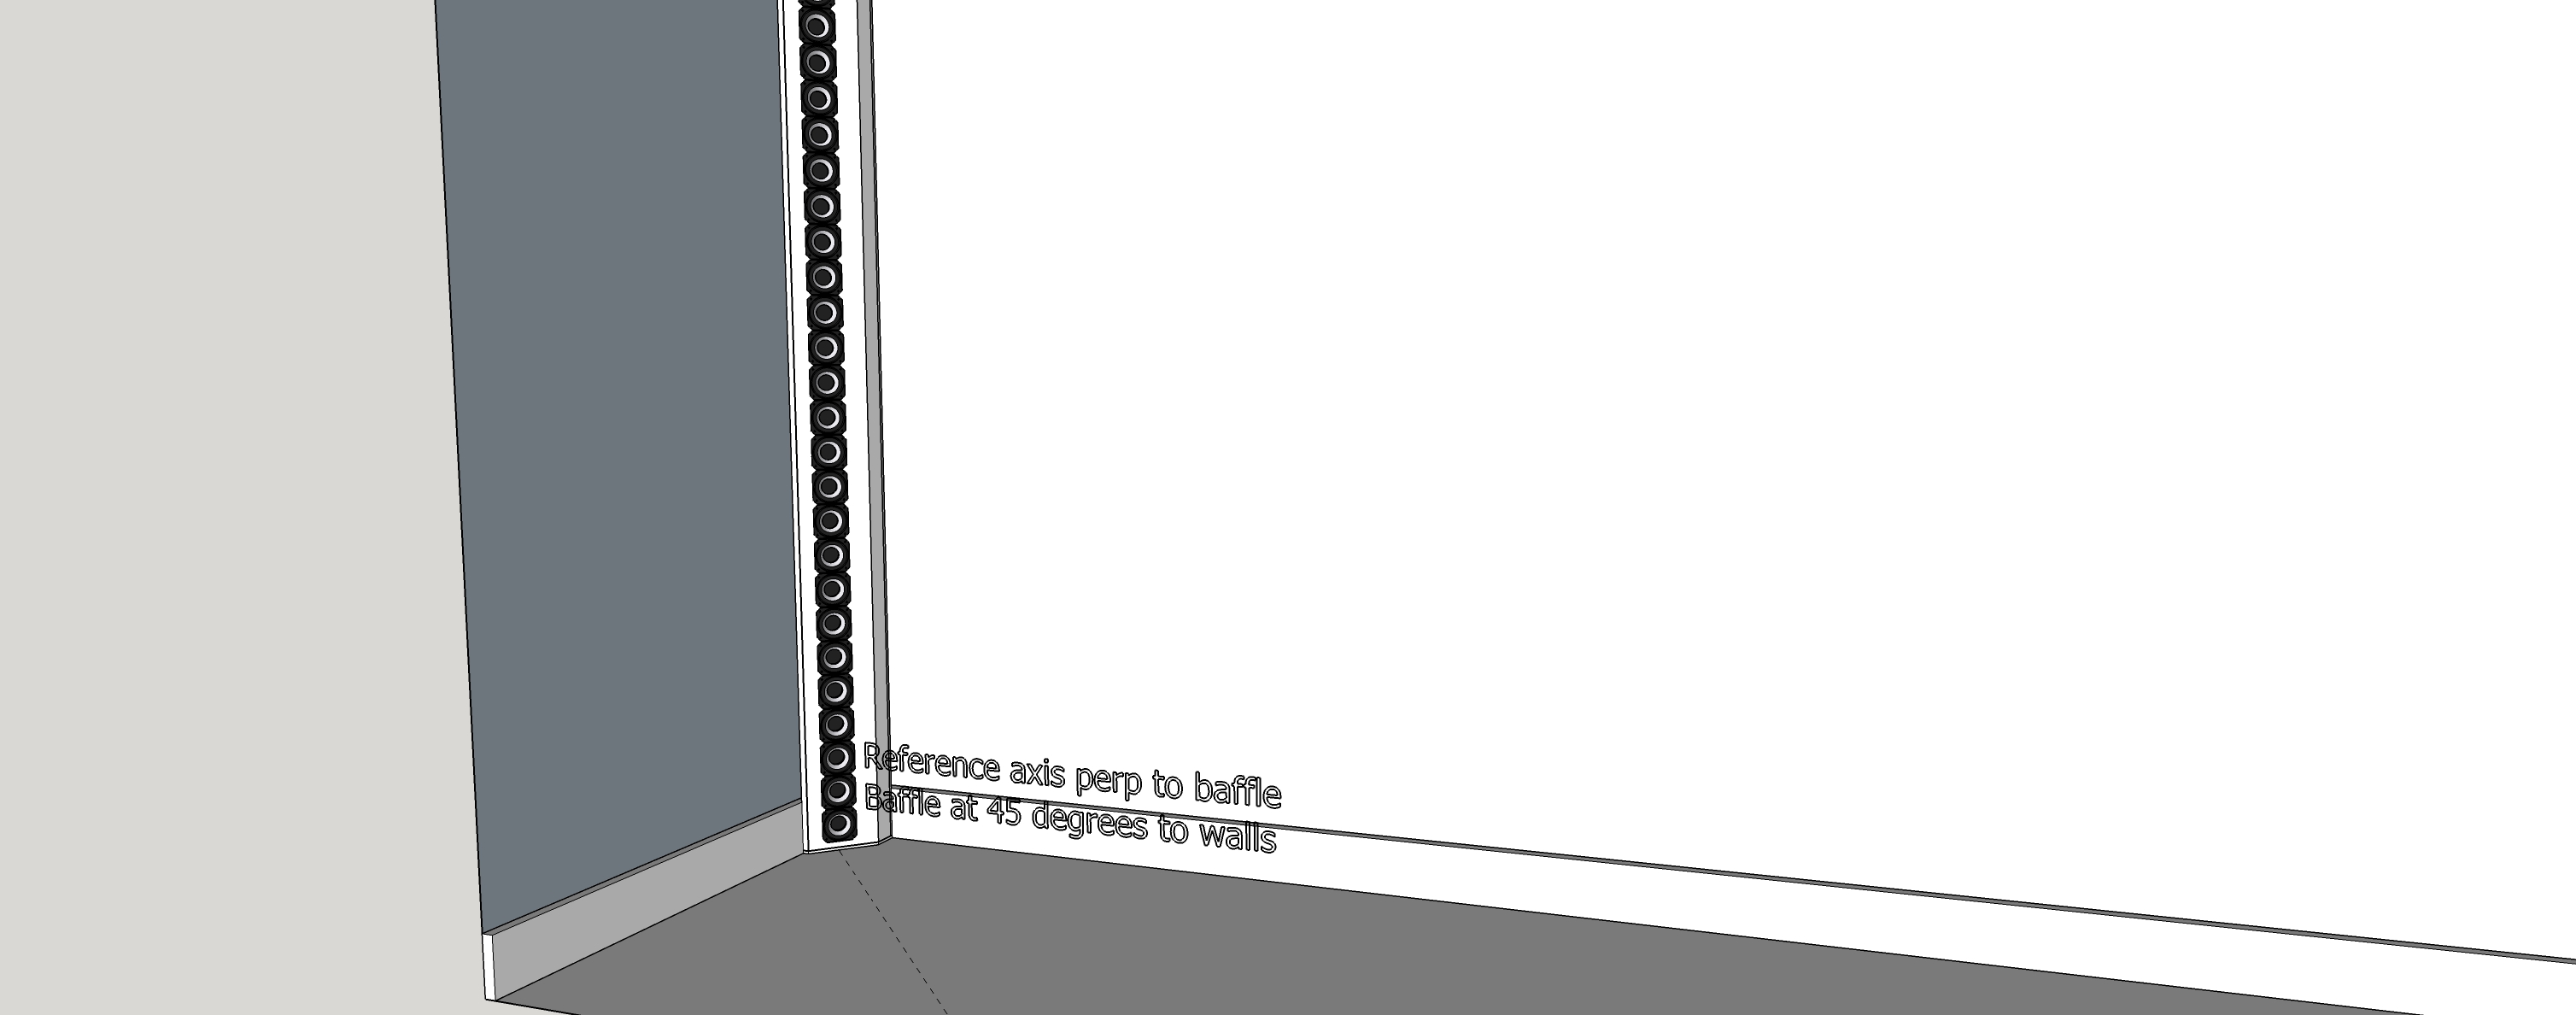
My baffle will be at 45 degrees relative to the walls while my listening window is perpendicular to the baffle, +/- 10 degrees. When there were no walls to consider, I entered rotation of zero for each driver and thus reference angle was on the drivers' axes. It seems clear I should enter a Rotation of 45 degrees for each driver but in that case, what happens to the horizontal listening window ? Does it rotate with the driver or do I have to rotate it via the reference angle entry on the main screen?
It will be easy enough to tell empirically because there won't be much treble 45 degrees off axis but I have been away from my desk most of the day.
Took just 30 seconds to try: answer seems to be I need to enter 45 as the reference angle also.
Attachments

Last edited:
- Home
- Design & Build
- Software Tools
- VituixCAD