This is an interesting graph, and seems to show what I had hoped to see.
It shows graphs of the first 50 eigenfrequencies vs slant.
I don't have access to m,n mode indices as with the exact solution, so I cannot trace the evolution of individual modes as before. Mode indices would lose their significance anyhow when moving away from rectangular geometry, I guess. Anyhow, you need to trace the curves by eye.
What is interesting is that in many cases, the apparent curves which are head toward a crossing point, actually do NOT cross, they diverge again.
I'm not saying this is a chaotic billiard (I don't think it could be with only straight edges), but this is the sort of thing I had hoped to show occurring as I introduce asymmetry. In the chaotic billiard literature, they talk about eigenmodes 'repelling', and this seems to be similar.
The horizontal resolution is only 100, so in some cases it may be an illusion, but certainly its a real effect...
I'd like to get a better graph but its not so easy to produce. I'd have to produce all the data, then scan back and forth doing linear extrapolation to assign data to a 'mode' line. I'm also having some issues with the solver failing at certain particular shapes. But if you run the mesh again and solve, it doesn't fail. So there must be some indeterminacy in the meshing and/or solving, plus a bug (in the solver I guess).
Comparison of the formula method vs fem method for mode stats vs aspect ratio. Resolution is 1000 points across in each case.
Blue is mean, orange is SD in each case. Agreement is not perfect, but the peaks at 2, 3, 4 are present. Sharpness of the peaks is less overall for FEM, and also gets less as the frequency increases.
Note the formula method graph is not identical to the one I posted before. At first I found the average and SD did not agree, and on closer inspection turns out I was using area=0.6 m^2 previously.
Believe you the laptop has to work hard! The good side is you have reach the target of an FEM simulation in a Python script working according to the criteria to improve. That's a very good step!First run of Elmer in Python, investigating the effect of introducing asymmetries into a rectangular panel.
.../...
Laptop has to work hard, being in a tight loop of meshing and FEM.
Christian
This is an interesting graph, and seems to show what I had hoped to see.
It shows graphs of the first 50 eigenfrequencies vs slant.
I don't have access to m,n mode indices as with the exact solution, so I cannot trace the evolution of individual modes as before. Mode indices would lose their significance anyhow when moving away from rectangular geometry, I guess. Anyhow, you need to trace the curves by eye.
What is interesting is that in many cases, the apparent curves which are head toward a crossing point, actually do NOT cross, they diverge again.
I'm not saying this is a chaotic billiard (I don't think it could be with only straight edges), but this is the sort of thing I had hoped to show occurring as I introduce asymmetry. In the chaotic billiard literature, they talk about eigenmodes 'repelling', and this seems to be similar.
Very cool Paul.
I think you are right about the mode indicies losing their significance. But I also think that your mode "lines" really do cross. When I look at your data I see some "smiley" face curves (highlighted below) that I suspect represent the true lines for particular modes. Probably if your resolution was higher you would see it more clearly. Recall how the "aspect ratio" graphs looked where there where clear "families" of curves where each "family" had a particular character and crossed over other families? I think it's realisitc to suspect that this graph would look similar in character to that if each line in the graph represented a particular mode.
Nice work.
Eric
Paul,Comparison of the formula method vs fem method for mode stats vs aspect ratio. Resolution is 1000 points across in each case.
Blue is mean, orange is SD in each case. Agreement is not perfect, but the peaks at 2, 3, 4 are present. Sharpness of the peaks is less overall for FEM, and also gets less as the frequency increases.
Note the formula method graph is not identical to the one I posted before. At first I found the average and SD did not agree, and on closer inspection turns out I was using area=0.6 m^2 previously.
Is your model based on the Kirchhoff plate (no shear deformation) or Mindlin or other? I think the "exact" solution for the simply supported plate actually only applies to the Kirchoff plate. I'm not certain of that but I think so.
My LISA model is based on the Kirchhoff plate.
I suspect that for a real plate, even if it is isotropic, the sharpness of the peaks (in the SD line) at integer aspect ratios would smaller than for the "exact" solution. I expect that different modes would be affected differently by shear deformations and rotational inertia, so that modes that "should" be at the same frequency for a (simplified) Kirchhoff plate wouldn't land in the same frequency for real plate, and that the amount of deviation would increase at increasing frequency, as the effects of shear and rotational inertia become more significant.
Eric
@pway
Hello Paul
Your script is in production now! excellent!... but too many new things for me in a single time...
May I ask few questions?
If you don't mind to post one of those scripts interacting with Elmer, it will be of a great help in my learning phase with Python/Elmer. I am still at the step to build my own plate to get the modes! Slow but in progress, may be a boost!
Christian
Hello Paul
Your script is in production now! excellent!... but too many new things for me in a single time...
May I ask few questions?
- about the plate, is it for all the posts (except #122) the one describes in #119, 0.5m², ratio 2, the slant index giving the reduction of one side and the increase of the opposite one? is it the long side? simply supported edges?
- about the histogram in vertical axis is it frequency or the number of modes having the gap of the horizontal axis?
- in #121, by which criteria, the frequencies are linked in the same curve for different slants? My question comes from the fact I known only for now 2 ways to organize the eigenfrequenies from calculation or simulation : by the knowledge of the m, n which are relevant for rectangular plates (in my FDM script I have a short algorithm to retrieve the m,n from the mode shape and make the link with the formula) or by sorting them. None of them seem applied here?
- I am not sure to understand the graphs in #122. Is the 1st graph FEM the second the SS plate formula? X axis are different (up to 5, to 6)
If you don't mind to post one of those scripts interacting with Elmer, it will be of a great help in my learning phase with Python/Elmer. I am still at the step to build my own plate to get the modes! Slow but in progress, may be a boost!
Christian
Christian,
- in #121, by which criteria, the frequencies are linked in the same curve for different slants? My question comes from the fact I known only for now 2 ways to organize the eigenfrequenies from calculation or simulation : by the knowledge of the m, n which are relevant for rectangular plates (in my FDM script I have a short algorithm to retrieve the m,n from the mode shape and make the link with the formula) or by sorting them. None of them seem applied here?
Of course Paul will correct me if I'm wrong, but my assumption for the graph in #121 is that the frequencies are sorted in order (say lowest to highest) and the "nth" line simply links the "nth" highest frequency for each aspect ratio. I think that's what you mean when you wrote "by sorting them". Let's see what Paul says!
That would explain why they never cross, right? But maybe I'm missing something.
Eric
All so true Paul. There's virtually an infinite amount of unexplored territory without getting into composites. I have some limited composites experience and equipment, so it's a natural way for me to go. But even with that I keep gravitating back to plywood! Arguably still a composite, but not really the same, since I can buy it at the local store.Well I now have a bunch of it so for the time being, I'll use that. Carbon fibre looks great but there is a lot of expense with the tooling and materials, quite a bit of skill to apply it, and a host of questions if the result is not as hoped. Did I use enough epoxy? Too much? Was the core strong enough? Did it delaminate? etc. I also feel there is a lot of unexplored territory with the cheaper materials, including shape (as I keep saying!), sculpting in the thickness dimension, applying skins of eg alfoil or mylar, a central insert of acrylic for hf, constrained layer damping, doublet or triplet panels with interleaved modes, applying a curve or pre-stressing, etc
I still want to believe I can engineer a better panel "composition" just like you (and I) believe we can engineer a better shape!
Eric
And my eyes (brain) were (was) confused by the shape not taking account of the colors, reading the graph as in your reply! You are right. One point perhaps to discuss is the validity to remove the modes that won't be productive to simplify the graphs. Currently I do shape by simply computing the mean value of each mode shape. The fully symmetric modes have a zero or about mean value.Christian,
Of course Paul will correct me if I'm wrong, but my assumption for the graph in #121 is that the frequencies are sorted in order (say lowest to highest) and the "nth" line simply links the "nth" highest frequency for each aspect ratio. I think that's what you mean when you wrote "by sorting them". Let's see what Paul says!
That would explain why they never cross, right? But maybe I'm missing something.
Eric
Christian
Those trends are very clear, and represent the evolution of something, of course, but I don't thing its correct to label them as the 'true' mode lines. While there are no double a few illusions cause by low res, there are also clear cases of modal divergence breaking up the original pattern. You can see each curve approach, then steer away from a point where they might have otherwise crossed.I see some "smiley" face curves (highlighted below) that I suspect represent the true lines for particular modes. Probably if your resolution was higher you would see it more clearly.
There will be patterns for each of these (intermediate) shapes also, because each will have its own characteristic symmetry.I think it's realisitc to suspect that this graph would look similar in character to that if each line in the graph represented a particular mode.
But I think we are also seeing partial 'breakup' of the original patterns with removal of a dominant symmetry and we are seeing remnant patterns in the mode lines.
I may try to do again at higher res, but to make it worthwhile I would need to write a script to extract the actual mode lines. Relatively easy by tracing one line at a time, and that should work reasonably well, but could not guarantee correct assignment globally. Maybe will ask in statistics stack overflow for a technique or existing code.
The takeaway I think is that there is an improvement of the SD of the mode gaps caused by fewer gaps at or near near zero. I don't think there is any way to arrive at this without there being fewer mode line crossings.
From the Elmer model manual chapter 9. "The linear elastic plate elements of Elmer are based on the shear deformable model of Reissner and Mindlin. The finite element discretization is performed using the so called stabilized MITC-plate elements, which are free from numerical locking. "Paul,
Is your model based on the Kirchhoff plate (no shear deformation) or Mindlin or other?
Yes the exact solution is as simple (or simpler?) model than Kirchoff, which is simpler model than Mindlin, which includes shear and rotational inertia I think. I'm mainly interested to see whether those peaks at 2.0, 3.0 persist or are essentially mathematical artifacts.I think the "exact" solution for the simply supported plate actually only applies to the Kirchoff plate.
I agree. Every imperfection and asymmetry in the build will tend to randomise the modes and flatten the peak, so I doubt it's even detectable in real builds. I do take it as another point on the scorecard of the 'eschew symmetry' philosophy of panel design.I suspect that for a real plate, even if it is isotropic, the sharpness of the peaks (in the SD line) at integer aspect ratios would smaller than for the "exact" solution. I expect that different modes would be affected differently by shear deformations and rotational inertia, so that modes that "should" be at the same frequency for a (simplified) Kirchhoff plate wouldn't land in the same frequency for real plate, and that the amount of deviation would increase at increasing frequency, as the effects of shear and rotational inertia become more significant.
")
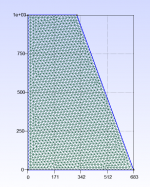
I will add full details to the title, should have done that already. Probably best if I just repost with better detail. But yes for the slant study starting aspect was 2, area normalised throughout to 0.5, simply supported edges. Geometry example below with slant = 0.3, giving 500 x (1+0.3) = 650 and 500x(1-0.3) = 350.@pway
Hello Paul
Your script is in production now! excellent!... but too many new things for me in a single time...
May I ask few questions?
- about the plate, is it for all the posts (except #122) the one describes in #119, 0.5m², ratio 2, the slant index giving the reduction of one side and the increase of the opposite one? is it the long side? simply supported edges?
Yes
- about the histogram in vertical axis is it frequency or the number of modes having the gap of the horizontal axis?
I think you sorted out this question with Eric.
- in #121, by which criteria, the frequencies are linked in the same curve for different slants? My question comes from the fact I known only for now 2 ways to organize the eigenfrequenies from calculation or simulation : by the knowledge of the m, n which are relevant for rectangular plates (in my FDM script I have a short algorithm to retrieve the m,n from the mode shape and make the link with the formula) or by sorting them. None of them seem applied here?
Yes first is FEM, second formula I didn't bother to make the axes the same.
- I am not sure to understand the graphs in #122. Is the 1st graph FEM the second the SS plate formula? X axis are different (up to 5, to 6)
No problem. Here is a snapshot. I will try to clean up a bit more etc and may add to a github site or re-post. One thing I remember that will be different on Linux - I'm writing to NUL file at one point, of course for you it will be /dev/null.If you don't mind to post one of those scripts interacting with Elmer, it will be of a great help in my learning phase with Python/Elmer. I am still at the step to build my own plate to get the modes! Slow but in progress, may be a boost!
Attachments
I'm thinking that the presentation mode of a forum is not really suited to what we are doing any more. A wiki would be a better fit, plus use of forum to post summaries of changes and discussion. We need a place where we are no overwhelmed by volume, where we can post something quickly and improve or correct it without duplication, where we can delete things that are no longer relevant, where we can start to flesh out the bigger picture, where we dont lose sight of the forest for all the trees. Maybe github is a better place to do much of this stuff. What do you guys think?
Hello PaulI'm thinking that the presentation mode of a forum is not really suited to what we are doing any more. A wiki would be a better fit, plus use of forum to post summaries of changes and discussion. We need a place where we are no overwhelmed by volume, where we can post something quickly and improve or correct it without duplication, where we can delete things that are no longer relevant, where we can start to flesh out the bigger picture, where we dont lose sight of the forest for all the trees. Maybe github is a better place to do much of this stuff. What do you guys think?
I am not not really experienced in the way to publish but for sure a forum is not the best way to do it. It is the reason I have opened a Github page (see within my signature on the left). I haven't had the time to push it really. Currently it is my option for keeping documents and will be to share scripts.
Christian
I will add full details to the title, should have done that already. Probably best if I just repost with better detail. But yes for the slant study starting aspect was 2, area normalised throughout to 0.5, simply supported edges. Geometry example below with slant = 0.3, giving 500 x (1+0.3) = 650 and 500x(1-0.3) = 350.
View attachment 1130956
Thank you Paul,
Yesterday I made some tests to compare Elmer output (eigenfrequencies of rectangular clamped plate). Elmer and the basic formula for a clamped rectangular plate and my FDM script give very close results when the Poisson's coeff is set to 0 in Elmer. Elmer takes into account much more phenomena. The model is more complex.
Christian
PaulNo problem. Here is a snapshot. I will try to clean up a bit more etc and may add to a github site or re-post. One thing I remember that will be different on Linux - I'm writing to NUL file at one point, of course for you it will be /dev/null.
Thank you for the script. It is of great help to me, in Python and in elmer.
I see you have applied a fixed (=simply supported) condition by setting deflection 1 to 0. In an example I found for clamped condition the 3 deflection conditions set to 0 (2 and 3 are rotations).
Have you found how to describe free edge conditions? setting none of the deflections?
Your example is also helpful to learn how to export the results.
In a wiki, I found that the normal deflection is under x direction in Paraview... some effect of the solver and paraview and also the advice to work with the shell solver which has not this drawback and offers more boundary conditions. To see.
Christian
That's good. My LISA is only Kichhoff, so your results should be more accurate. Mindlin elements would particularly would be good for PS foam plates, assuming they are thicker than most other plates.From the Elmer model manual chapter 9. "The linear elastic plate elements of Elmer are based on the shear deformable model of Reissner and Mindlin. The finite element discretization is performed using the so called stabilized MITC-plate elements, which are free from numerical locking. "
But you need more properties, unless you can assume it's isotropic.
Eric
I missed replying to this yesterdayAnd my eyes (brain) were (was) confused by the shape not taking account of the colors, reading the graph as in your reply! You are right. One point perhaps to discuss is the validity to remove the modes that won't be productive to simplify the graphs. Currently I do shape by simply computing the mean value of each mode shape. The fully symmetric modes have a zero or about mean value.
Christian
On removing unproductive modes. Yes, maybe. But its a lot more effort (both for me and for the computer) to determine the unproductive modes at each cycle than just to do everything. Note that productive mode could become unproductive & vice versa at some point as a parameter is changed. I think the productive modes will show similar statistics to all modes taken together.
I'm trying to look at the theory again of how far field SPL is calculated. I guess we could apply Raleigh integral in software, but we need velocity.
I assume that for a simple unforced resonant response, you can take the displacement to be similar to velocity, because where there is maximum displacement, there will be maximum velocity when it moves. I assume the with a forced response the form of the eigenfunctions change depending upon the excitation point.
I notice that Elmer has both Helmholtz and an undocumented BEM solver. The trouble is with unvalidated models you never know if your results are garbage or not (even if you are lucky enough to have applied it correctly).
Eric, have you done a forced response run yet in LISA? What data does is output? I guess we also need a realistic estimate of damping constant before doing the forced run.
The model seems to be isotropic, since Ive only seen examples with one value of Youngs Modulus applied.That's good. My LISA is only Kichhoff, so your results should be more accurate. Mindlin elements would particularly would be good for PS foam plates, assuming they are thicker than most other plates.
But you need more properties, unless you can assume it's isotropic.
Eric
Yes as I recall for free I just removed all conditions. You need to be careful applying different BCs on different sides, because I think Elmer grid renumbers the elements ! I have not investigated this deeply yet.Paul
Thank you for the script. It is of great help to me, in Python and in elmer.
I see you have applied a fixed (=simply supported) condition by setting deflection 1 to 0. In an example I found for clamped condition the 3 deflection conditions set to 0 (2 and 3 are rotations).
Have you found how to describe free edge conditions? setting none of the deflections?
Your example is also helpful to learn how to export the results.
In a wiki, I found that the normal deflection is under x direction in Paraview... some effect of the solver and paraview and also the advice to work with the shell solver which has not this drawback and offers more boundary conditions. To see.
Christian
Also, Eric asked some time ago about 'soft' BCs as documented in the models manual. In the solver manual it describes that the 'soft' refers to soft limiting - applying a constraint based upon some condition. So 'soft' means 'under software control' and not as Eric had hoped providing another type of BC for edges 'softer' than simple support.
- Home
- Loudspeakers
- Full Range
- Application of Impulse Excitation for DML Design and Analysis