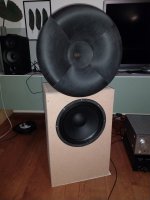
I tested the new waveguide, still in my living room and only on-axis for now. I did do 8 measurements at different distances in order to average out reflections. I did the measurements quite close to the waveguide to minimize relative reflection strength and maximize 'echo'-time. I'm afraid that as I'm quite close, that might have averages out diffraction-wiggles also.
Here is the comparison with the Faital (HF108) factory data:
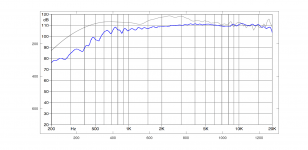
Looking through some global differences, I think I see quite a good match in the wiggles (scientific term...), although somewhat shifted around 10kHz. Or do I want to see that?
So, what can I learn from this? That seems to be a recurring question. I measure something, I do some processing, and then... blank...
Here is the comparison with the Faital (HF108) factory data:

Looking through some global differences, I think I see quite a good match in the wiggles (scientific term...), although somewhat shifted around 10kHz. Or do I want to see that?
So, what can I learn from this? That seems to be a recurring question. I measure something, I do some processing, and then... blank...
Last edited:
Personally, for a cost conscious design I'd chose the Dayton PA310, Celestion H1-9040 WG (depends on coverage needed) and the Celestion CDX1-1745 driver crossed around 1500 (depending on xover sim results). The PA310 goes pretty low and plays cleaner higher up than most 12s in its price range. 2 cu ft ported puts you in the low 50s hz cutoff range with good power handling if you want to use it with subs in an active system.
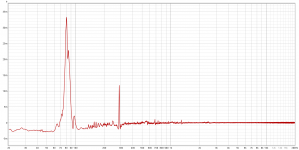
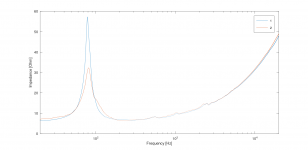
Here is an impedance comparison between the two prototypes:
And here is the difference
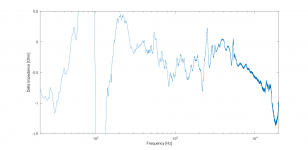
It is clear that impedance peak is much lower. A second peak has become more clear. If you look carefully, it is already present in prototype I. Where does that come from? Is it good or bad? And why should I strive for a lower impedance peak (with a low output impedance amplifier) at all?
Given the amount of damping, I was hoping for a very smooth impedance graph, but I think Prototype I has a smoother graph, although it might all be insignificant.
Btw, the double baffle (+ brace) is a no brainer. Virtually no vibration (at low level playing...) vs. clearly 'feelable' vibrations for Prototype I.

And here is the difference

It is clear that impedance peak is much lower. A second peak has become more clear. If you look carefully, it is already present in prototype I. Where does that come from? Is it good or bad? And why should I strive for a lower impedance peak (with a low output impedance amplifier) at all?
Given the amount of damping, I was hoping for a very smooth impedance graph, but I think Prototype I has a smoother graph, although it might all be insignificant.
Btw, the double baffle (+ brace) is a no brainer. Virtually no vibration (at low level playing...) vs. clearly 'feelable' vibrations for Prototype I.
Lower peak means more damping. Causes: differences between units (exchange them), leaks in the enclosure or differences in internal damping. I'm too lazy for that now, but you can calculate the Qtc from both peaks and decide if it's problematic. Honestly, I don't think you will notice the difference with your ears alone.
The other bumps are either driver resonances or standing waves in the enclosure, I'd say. I often perform a Burst Decay plot to examine such phenomena further.
The other bumps are either driver resonances or standing waves in the enclosure, I'd say. I often perform a Burst Decay plot to examine such phenomena further.
The two prototypes are completely different:differences in internal damping
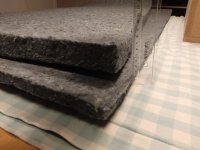
- prototype I has no initial damping nor bracing. I only stuffed the first blanket I could find in it.
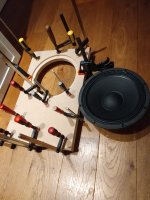
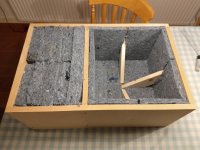
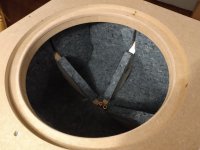
- prototype II is braced, has a double baffle and is seriously damped.
The lower impedance peak was expected. But is that good and why? And what about the other features/wiggles/peak?
I'll try to do the test you mention.
I think the other wiggles/peaks are driver related. They should have dissappeared in the seriously damped enclosure, although I am inclined to say the section behind the driver could be stuffed more if you want it to be seriously damped. Did you perform free air impedance measurements?
Yes. Here is a comparison of fee air and prototype I (still without the blanket inside): https://www.diyaudio.com/community/threads/efficient-2-way.380822/post-7237047Did you perform free air impedance measurements?
The obvious wiggles are indeed already present in the free air measurements. I'm nitpicking about the smaller ones in an attempt to learn something.
I think there is too much damping in there, felt is very effective and that is a lot of it. I would probably try a single layer around the outside and a layer on top of the brace for the length mode.
The impedance shape around the peak has become lopsided, the shape to the right is straight and not symmetrical. The damping should widen the sides and reduce the height from lowering the Q but not distort the shape.
The extra stuff other than the driver resonances looks like noise. A clean impedance measurement needs a low impedance source with good current drive like a headphone amplifier or similar power amplifier. Be careful if you go with a power amp not to blow up the soundcard input.
The resistor value should be low too but that puts more demands on the current capability of the driving amplifier. I think extra damping tends to make this look worse too.
It looks to me as the single impedance peak is built up of several peaks: the main peak and some smaller ones. By lowering the main peak (by the damping), the lower peak(s) become more obvious and make the shape lopsided.The impedance shape around the peak has become lopsided, the shape to the right is straight and not symmetrical. The damping should widen the sides and reduce the height from lowering the Q but not distort the shape.
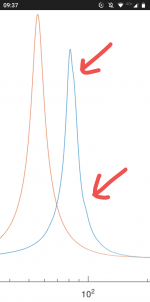
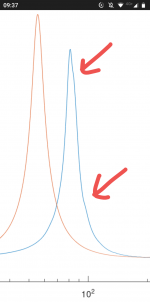
Here is a close up of the impedance peak in an undamped enclosure (early proto 1):
I found out that the GD (group delay I guess) also shows peaks and wiggles where the impedance plot does. The GD looks 'more precise' and might be easier to interpret as ideally it should be a flat line at zero. There is no inherent impedance shape you have to subtract in your head (which I was trying to do by fitting the impedance curve by a model a few posts back).
Unfortunately I'm away from the computer and can't attach a GD graph.
And besides the lobsided impedance peak's origin, why does it indicate over damping and what does that do to the sound? And as the enclosures job is to keep to back radiation from reaching the listener, how can it ever be over damped?
On impedance measurements: I prefer the power amp solution, such as described in the ARTA/LIMP manual, using a resistor in the range 27-39Ω, as opposed to the methods with a much higher series resistor. It is more precise and using some current instead of hardly any, the driver is measured in circumstances that are alike to those when the system is in use. So thermal and other nonlinearities (e.g. from damping solutions) do show up better. Disclaimer: TSP are small signal anyway and I'm not a firm believer of exactly tuned bass arrangements.
On too much damping: here comes the BD-plot in handy. The enclosure in this speaker (response without crossover) has foam damping on all walls and a piece of foam on a dividing brace. The resonances in the enclosure are obvious and above -30dB plus more than 8 periods. For critical applications I'd add some more here. Point is: measure!

On too much damping: here comes the BD-plot in handy. The enclosure in this speaker (response without crossover) has foam damping on all walls and a piece of foam on a dividing brace. The resonances in the enclosure are obvious and above -30dB plus more than 8 periods. For critical applications I'd add some more here. Point is: measure!
The subtracting in your head, fitting and difference measuring makes no sense to me. The impedance plot is showing you resonances, if they exist in the driver damping and bracing isn't going to have much effect. This is why comparing free air to cabinet is useful to see what comes from where. The damping scheme in this context has two aims, to reduce or remove resonances that come from the cabinet and affecting the alignment and extension of the bass from changing the apparent air volume seen by the driver and damping it's main resonance to whatever degree is desired.The GD looks 'more precise' and might be easier to interpret as ideally it should be a flat line at zero. There is no inherent impedance shape you have to subtract in your head (which I was trying to do by fitting the impedance curve by a model a few posts back).
When you progressively add damping or try out various schemes you can see a progression of the effects the material is having. It takes a lot of material to cause the main peak to become asymmetrical enough to be obvious. To me this a sign that the enclosure is now having a negative impact. Absolutely it can be overdamped, the air and spring behind the driver has an effect on the forward radiation, not just in trying to stop the rear radiation from having an impact.And besides the lobsided impedance peak's origin, why does it indicate over damping and what does that do to the sound? And as the enclosures job is to keep to back radiation from reaching the listener, how can it ever be over damped?
Like many subtle phenomena it may be hard to hear or isolate, particularly if only just beyond being obvious in a measurement. Look at all the measurements that are available, compare and contrast, listen if you can hear any difference. There is the inherent time frequency trade off when looking at resonant behaviour, look at it from as many different angles as you can.
Hi, What do you think about matching Faitalpro 12PR320 with Celestion CDX1-1446 plus Dayton H6512 horn, active DSP xover aprox. 1500Hz? I know that CXD1-1746 would be more suitable, but is hard to purchase.
In an attempt to highlight any impedance anomalies I tried to model impedance of the speaker (in a closed box). The plan was to fit that model to the measurement and than subtract it from the measurement.
Unfortunately the fitting does not work well. The model seems off.
Model:
View attachment 1144776
Fit:
View attachment 1144774
Fit was limited to impedance peak.
View attachment 1144775
Full frequency fit.
But the shape of the impedance plot in vituixcad does match my model:
View attachment 1144773
What is going on here?
I found a paper (https://www.researchgate.net/public...uit_Model_for_Dynamic_Moving_Coil_Transducers) that explains this. It is caused by Eddy currents and results in a 'semi-inductor' which introduces a sqrt(jw) term (or sqrt(s) in Laplace) which causes the impedance to rise with 3dB/octave iso 6dB/octave.
I will try to implement the model described in that paper and see if I can get it to fit my measurements.
Since you seem into it, I'll add further reading 😉. This one tries to add the position of the voice coil into the equation. Spoiler alert: the enclosure and stuffing have to be modelled better too if you want this to succeed. And even the speaker - room interaction adds further complications for modelling. Most of us don't go there.
Attachments
I tried looking at it from a control theory point of view. I don't see how increasing damping would automatically lead to asymmetry.When you progressively add damping or try out various schemes you can see a progression of the effects the material is having. It takes a lot of material to cause the main peak to become asymmetrical enough to be obvious. To me this a sign that the enclosure is now having a negative impact. Absolutely it can be overdamped, the air and spring behind the driver has an effect on the forward radiation, not just in trying to stop the rear radiation from having an impact.
I also tried to interpret overdamped in that sense. For the 'normal' (series) second order system we have:
0 < Zeta < 1 means underdamped and you have some oscillation after a step
Zeta = 1 means critically damped and you just have no oscillation
Zeta > 1 means overdamped. The system is slower than it needs to be.
For a series LRC system this is quite easily mapped onto L, R and C. However, for a parallel second order system (which we have in a speaker) it is not clear to me how to calculate Zeta in terms of L, R and C. So I don't know when it is overdamped (in a control theory sense).
I got my copy of Testing Loudspeakers today and it had one impedance plot that looked kinda similar to mine. It was said the brace divided the enclosure into two resonant systems with their own resonant frequency. That makes sense. That would give me the plot I have.
In the book it was solved by enlarging the holes in the brace, but I didn't think that was my problem. I did have a piece of filt on top of the brace that I could easily remove (as I didn't put glue on it...).
Low and behold:
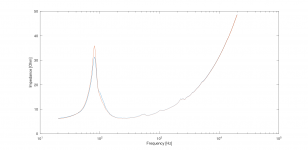
red: without felt
blue: with felt
I also did a test with 4 and 8 screws to mount the speaker. Just because. The test results are extremely similar down to the smallest wiggles except for one spot:
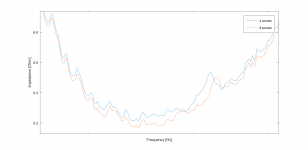
difference at 320Hz
So now I have to optimize the amount of screws mounting the woofer to the baffle ;-)
In the book it was solved by enlarging the holes in the brace, but I didn't think that was my problem. I did have a piece of filt on top of the brace that I could easily remove (as I didn't put glue on it...).
Low and behold:

red: without felt
blue: with felt
I also did a test with 4 and 8 screws to mount the speaker. Just because. The test results are extremely similar down to the smallest wiggles except for one spot:

difference at 320Hz
So now I have to optimize the amount of screws mounting the woofer to the baffle ;-)
- Home
- Loudspeakers
- Multi-Way
- Efficient 2-way
