It's calculus, but it's not too hard to understand.
Derivative is the rate of change of the y (vertical) axis with respect to the x (horizontal) axis (in math notation dy/dx); here the axes are two of the space dimensions.
A horizontal line has dy/dx = 0; y doesn't change.
The rate of change of the first derivative is the second derivative, d^2y/dx.
Also it has zero curvature (as do all straight lines).
Tilt the line up at the right and it now has a positive slope.
Now if the slope is increased with x, the line curves upward (concave up like a bowl), and curvature d^2y/dx is now positive.
gedlee said:I am nothing short of completely swamped with work at this point. I too am very interested in those results, but they will have to wait until I get some free time.
Not a problem - thanks Earl. I look forward to seeing the plots in due course.
Kind regards,
David
ScottG said:
I think "bounding" is also important here, and not defined. (..though its absence didn't occur to me until just now re-reading it again.)
(For others: Wavelength/frequency *length* equal to or greater than the opening at any point in the waveguide equals "bounding".) I think.. correct me if I'm wrong.")
I don't understand your last sentance, but bounding means boundary. The bounding curve defines the boundary of the waveguide.
Scott, if you don't understand something ask, but don't chastize the writer because you don't understand, since it may not be his fault.
gedlee said:.
Scott, if you don't understand something ask, but don't chastize the writer because you don't understand, since it may not be his fault.
chastize? punish?
That was never the intent. Life is just to short to go around and try and "punish" others even if I wanted to, and I don't.
..and note that I did understand it (the reply generally), but only after multiple re-readings. (See my first reply.)
My first reply was simply to point out to others that:
1. a claim of "lowest diffraction" is perhaps correct, but only if you place particular (and likely impractical) limits on the definition. Furthermore that such claims read like add-copy, and promotes a seemingly perpetual debate of "mine is bigger than yours".
2. that the relative worth to lower diffraction in the context you presented *may* be low or non-existent to readers of this forum.
This information isn't there to say: "Earl's wrong, bad bad Earl".
Instead the information is there in an attempt to increase the concept of "full disclosure" for readers - which IMO leads to better communication.
My additional reply's were just there to explain where I thought there was room for improvement with respect to further communication on the subject of diffraction and waveguides.
In other words its all about Editing. That's it.
(..of course none of the above takes into consideration if you find editing punishing.)

Earl,
When making polar maps, do you do any sort of normalizing of the data? I've started looking into polar maps now, and just using the raw frequency response gives a very weird looking plot. Normalizing to the on-axis response looks much better, but judging from the polar map for the Abbey at your website, this is not what you are doing.
Do you have any suggestions on how to best do this?
Thanks,
Bjørn
Normalizing is a BIG mistake. The advantage of a polar map is how much it can tell you at a single glance, but if you normalize it then you are making interpretation much more difficult. With CD waveguides that are unequalized you will get a very odd polar map. Thats because an un-EQ'd CD waveguide is not really usable without EQ. So the question is always how much EQ to apply. Thats really the issue. Normalizing to the axial response is a very bad way to go for the proper EQ both for the polar map as well as the real world.
In simulations, I would simply use a +6 dB/oct filter on the data and leave it at that.
In simulations, I would simply use a +6 dB/oct filter on the data and leave it at that.
gedlee said:Normalizing is a BIG mistake.
I can understand that, the plots look pretty odd no matter what kind of normalizing I use.
In simulations, I would simply use a +6 dB/oct filter on the data and leave it at that.
I see. So basically remove the effect of the driver mass (and compression chamber compliance) roll-off, and that's it?
Thanks for your advice.
Bjørn
Kolbrek said:So basically remove the effect of the driver mass (and compression chamber compliance) roll-off, and that's it?
Bjørn
Well not so much that as the fact that any constant directivity device has to have an axial response that follows the source velocity regardless of any mass or compliance issues. Hence, for any mechanical source, CD requires a +6 dB/oct correction for any diaphragm operating above resonance since they will have a velocity falling at -6db/Oct. In its most general sense that what CD means, the axial response and the power/polar response track one another. No other type of source does this.
Dr. Geddes, can You specify any kind of magnitude for the second derivative (SD) anywhere on the "curve" before it gets bad ?
I mean, I calculated some WG´s for fun and their SD´s and compared with other curves that i managed to get below the initial SD of the OS, but not to zero.
This is a honest inquiry, not to fight.
I mean, I calculated some WG´s for fun and their SD´s and compared with other curves that i managed to get below the initial SD of the OS, but not to zero.
This is a honest inquiry, not to fight.
-CGL- said:Dr. Geddes, can You specify any kind of magnitude for the second derivative (SD) anywhere on the "curve" before it gets bad ?
I mean, I calculated some WG´s for fun and their SD´s and compared with other curves that i managed to get below the initial SD of the OS, but not to zero.
This is a honest inquiry, not to fight.
I understand, because I had the same idea and tried it out just last night.
You can get the 2nd derivative to go to zero (it does for the OS at larger x) but starts out lower than the OS for a function that is piecewise continuous, but not for a continuous function. That is the sense at which the OS is optimum and a catenoid. I too was able to get a lower 2nd D with piece-wise continuos function and I have to admit that this idea is interesting. I'm not willing to give away the functions just yet.
I do suspect that the 2nd D integrated form zero to the waveguides end will be lowest for the OS for any continuous function, but the math behind its derivation does not allow for piecewise continuos functions. Hence allowing them might result in some interesting ideas.
I did this work after reading a post by Jean-Michel who compared his 2nd D to the OS, and, as suspected, it was misleading. His curves do not start with zero slope and so they won't match the throat of the driver and this will generate HOMs but will not appear in his curves. It is possible to set the slope of the early exponential section to match the 6 degrees of the driver, but this yields a very slowly flaring device which would need to be exceedingly long to yield a mouth of any appreciable diameter. Thus he adds a wide flare at the mouth which adds lots of 2nd D and diffraction. If you make an exponential horn that initially flares as fast as an OS then it has much higher 2nd D all the way along its length.
SO the question becomes, is diffraction better at the throat than at the mouth? I suggest that with the foam that I use the answer is "absolutely" because the HOM created at the throat get absorbed while the ones at the mouth do not. If you postpone the diffraction to the mouth, then there is no way to minimize it. Bottom line to me; what I am currently doing still appears to be the ideal as all other approachs will yield more diffraction at the listener.
The term "piece-wise continuos" implies some discontinuity? Probably you are refering to different functions at different parts of the wave guide as I had mentioned?
Due to the pressure difference at the mouth, the diffraction strength will be lower as well. I don't think Jean-Michel included the lip radius that blends with the baffle in his comparison either. Based on the spread sheet that Jean-Michel made available, there is a factor to consider adjustment to match driver exit angle.
Due to the pressure difference at the mouth, the diffraction strength will be lower as well. I don't think Jean-Michel included the lip radius that blends with the baffle in his comparison either. Based on the spread sheet that Jean-Michel made available, there is a factor to consider adjustment to match driver exit angle.
gedlee said:
I understand, because I had the same idea and tried it out just last night.
You can get the 2nd derivative to go to zero (it does for the OS at larger x) but starts out lower than the OS for a function that is piecewise continuous, but not for a continuous function. That is the sense at which the OS is optimum and a catenoid. I too was able to get a lower 2nd D with piece-wise continuos function and I have to admit that this idea is interesting. I'm not willing to give away the functions just yet.
I do suspect that the 2nd D integrated form zero to the waveguides end will be lowest for the OS for any continuous function, but the math behind its derivation does not allow for piecewise continuos functions. Hence allowing them might result in some interesting ideas.
I did this work after reading a post by Jean-Michel who compared his 2nd D to the OS, and, as suspected, it was misleading. His curves do not start with zero slope and so they won't match the throat of the driver and this will generate HOMs but will not appear in his curves. It is possible to set the slope of the early exponential section to match the 6 degrees of the driver, but this yields a very slowly flaring device which would need to be exceedingly long to yield a mouth of any appreciable diameter. Thus he adds a wide flare at the mouth which adds lots of 2nd D and diffraction. If you make an exponential horn that initially flares as fast as an OS then it has much higher 2nd D all the way along its length.
SO the question becomes, is diffraction better at the throat than at the mouth? I suggest that with the foam that I use the answer is "absolutely" because the HOM created at the throat get absorbed while the ones at the mouth do not. If you postpone the diffraction to the mouth, then there is no way to minimize it. Bottom line to me; what I am currently doing still appears to be the ideal as all other approachs will yield more diffraction at the listener.
I´m not even trying to describe the curve with a continuous function. Way beyond my ability.
I´m not even trying to get constant-directivity, but constantly-changing-directivity. I´m interested in getting the driver-waveguide transfer working nicely. The mouth termination problem I´m familiar with.
And no, I don´t want to fight about the changing BW either
soongsc said:Due to the pressure difference at the mouth, the diffraction strength will be lower as well.
But so is the signal and there is a much greater path of diffraction - the mouth circumference. So the implication that mouth diffraction is somehow of lessor severity is not justified.
Member
Joined 2003
Earl,
The image POS posted reminded me of an idea I wanted to run by you.
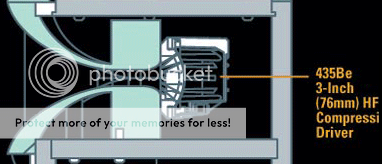
What if we use the OS curve to join the driver exit to the WG entry? This would avoid the abrupt angular transition existing in many drivers and provide a relatively smooth path from diaphragm to WG mouth.
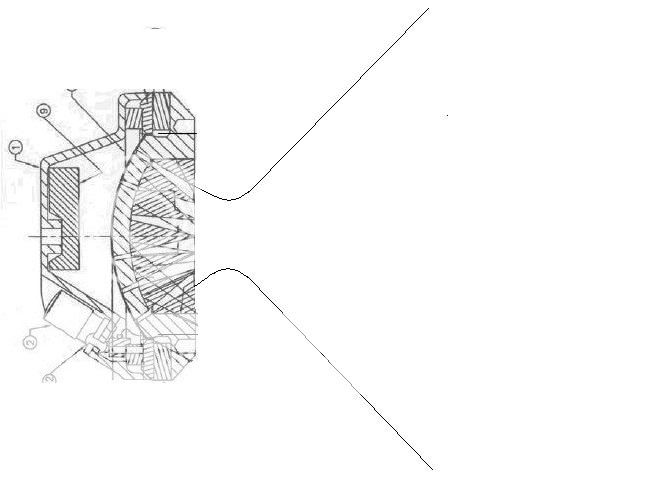
(Curve is not accurate due to my artistic ineptitude)
Paul
The image POS posted reminded me of an idea I wanted to run by you.
What if we use the OS curve to join the driver exit to the WG entry? This would avoid the abrupt angular transition existing in many drivers and provide a relatively smooth path from diaphragm to WG mouth.
(Curve is not accurate due to my artistic ineptitude)
Paul
I don't think that this would be a very good idea as the bottle neck would create a lot of diffraction.
The wavefront at the exit of the phase plug is intended to be flat so the walls should come straight out to match this. The angle right at the exit of the phase plug is not important because its how they all add up in the aperature where the channels combine that matters. There were some phase plugs done with the channels curved so that they exited straight. This might be a good idea. But how the phase plugs are done is a real can of worms and one that would take a great deal of study to improve upon as they have been arround a long time. We know that they aren't ideal, but they are what they are for the time being.
The wavefront at the exit of the phase plug is intended to be flat so the walls should come straight out to match this. The angle right at the exit of the phase plug is not important because its how they all add up in the aperature where the channels combine that matters. There were some phase plugs done with the channels curved so that they exited straight. This might be a good idea. But how the phase plugs are done is a real can of worms and one that would take a great deal of study to improve upon as they have been arround a long time. We know that they aren't ideal, but they are what they are for the time being.
Yes, and the diffraction wave shape/frequency content would be different due to different curvature.gedlee said:
But so is the signal and there is a much greater path of diffraction - the mouth circumference. So the implication that mouth diffraction is somehow of lessor severity is not justified.
Hello Paul W.
Seems to me that JBL get their inspiration from a patent in date of 1979 from Meyer .
See attached file:
Best regards from Paris, France
Jean-Michel Le Cléac'h
Seems to me that JBL get their inspiration from a patent in date of 1979 from Meyer .
See attached file:
Best regards from Paris, France
Jean-Michel Le Cléac'h
Paul W said:Earl,
The image POS posted reminded me of an idea I wanted to run by you.
What if we use the OS curve to join the driver exit to the WG entry? This would avoid the abrupt angular transition existing in many drivers and provide a relatively smooth path from diaphragm to WG mouth.
(Curve is not accurate due to my artistic ineptitude)
Paul
Attachments
I've implemented various method of presenting a polar map now. Here are 3 different versions for the small OS waveguide I simulated some time ago, including the driver internal flare.
The top plot shows the waveguide with constant throat velocity. The middle one shows the waveguide with a driver model added, including a +6dB/oct EQ, as suggested by Earl. The bottom plot shows the waveguide with a "Matched source", as described by Keele in the AES preprint "What's so sacred about exponential horns?". In short, the waveguide is driven by an acoustical source with a source impedance equal to rho*c/Sth, where Sth is the throat area of the horn/waveguide. In a way, this source is a driver without mass or compliance.
Earl, if these plots look sensible, I'll post data for the Le Cléac'h horn too. I just want to make sure I do it right first
Bjørn
Attachments
Great. Then here is the 'Matched Source' polar maps for the OS waveguide (once again, but in full resolution) and the AH-425 Le Cléac'h horn (lower plot).
I will leave comments to others. I'm just providing the data for your amusement, and then I'll take a long easter break
Bjørn
I will leave comments to others. I'm just providing the data for your amusement, and then I'll take a long easter break
Bjørn
Attachments
- Home
- Loudspeakers
- Multi-Way
- Geddes on Waveguides