In this case headphones can still be useful to at least cancel out some variables.I do not agree. Using headphones is a mistake because all detectors are not in use. Ears are not very good for sensing pressure differences. They are very smart with timbre/tone but timing error does not change much that - subjectively.
The word pressure difference is a bit strange, since an acoustic wave = difference in pressure.
But what I understand from your description is the physical feeling in the body instead?
In that case it's very difficult to sort room modes from actual the difference from speakers themselves, as I said before.
As for recordings, 99.8% is artificial anyway.
Adding way more details than a lot of instruments naturally have or a person is able to hear in a practical room.
Or not hearing things that can be heard very clearly when the instrument is in the room.
For pianos the thumping sound of the pedal is a good example.
For a guitar certain squeaks, thumps and buzzes etc, list goes on and on.
Exactly. It's really amazing how low volume is needed to sense wide-band transients if timing is not destroyed with high excess group delay at LF. Of course magnitude response has to be okay and music should contain those (unlimited) transients. For example all piano recordings don't have normal/strong hammer hit, and some - usually played with electric piano have very strong because there is no reflections. Also these differences are very easy to sense with low volume.
Isn't the pressure directly readable in VituixCAD impulse response window? If I'm understanding right the group delay spreads the impulse response making pressure peak lower and this changes "the feel" ? To get max pressure we need low excess group delay? Is there any point read the impulse response graph while designing a system or is it enough to just keep eye on the excess group delay?
I'm trying to get hold on how to judge from VituixCAD graphs when there is the tangible feel to the sound and when there is not. I'd like to preserve the tangible feel while tuning the frequency response, the filters, but not sure what should I be looking at? If looking just the magnitude graphs the feel can be lost.
If thinking is straigth the pressure value changes with system sensitivity and overall SPL capability and listening level so absolute pressure level doesnt necessarily mean there is "the feel". Perhaps relative pressure level tells it? I mean keeping eye on impulse response window while tuning filters, taking notes when the impulse response pressure gets high values would indicate sound will more likely to have "the feel"? Conversely, if tuning filters and the peak pressure seems to drop it could mean the feel might get lost.
If low excess group delay means there is the feel could the impulse response pressure reading then be used to fine tune more of it? How do I know if I can get more of the feel, how far can I go? and FIR can help maximize the pressure reading, minimize excess group delay and thus maximize the feel? 😀 interesting subject it is
Last edited:
Ehm, fyi the frequency response = impulse response = step response.Isn't the pressure directly readable in VituixCAD impulse response window? If I'm understanding right the group delay spreads the impulse response making pressure peak lower and this changes "the feel" ?
GD is derived from them as well. So we are looking at exactly the same thing, just in a different format basically.
I would dive into some Fourier Transform books, or rather Control Theory books (Control Systems Engineering by Norman Niseas is a good start) as well as digital signal processing (like; Digital Signal Filtering, Analysis and Restoration or so, but there are many others).
I can literally not make any sense what you're saying afterwards, it certainly does not involve group delay.
The physical pressure in sense of feel, that has been described, can certainly not be found in the things you're talking about.
Of course, and the latest studies I know are done with headphones - again, but the result still shows that group delay introduced by IIR crossover of multi-way is clearly audible. Typical 2-way is not so clear, but for example 3-way with 4th order slopes at typical frequencies is certain - also via headphones. Possible problem is that test with impulse may not measure effect to punch/pressure hit. Just changes in tone. That could correlate for example with changes in soundstage (which is not so much reated to music itself).In this case headphones can still be useful to at least cancel out some variables.
I was talking about threshold of change in sound pressure. This is a bit difficult to translate from Finnish to English due to our local language shortcuts.The word pressure difference is a bit strange, since an acoustic wave = difference in pressure.
Listening position does not matter because pressure hit is almost pure direct sound if GD is quite constant down to LF. The first few reflections may alter the pressure after few ms.In that case it's very difficult to sort room modes from actual the difference from speakers themselves, as I said before.
Bad excuse. Timing errors affects to sound reproduction no matter is recording synthetic or pristine acoustic live.As for recordings, 99.8% is artificial anyway.
Peak pressure is readable from left scale, but peak value is not very good benchmark because it's for example sensitive to frequency response at HF. ETC curve would be the most visual and easiest to monitor while changes and comparing to others, but unfortunately it's dB value normalized to 0 dB = peak pressure. Also shape of ETC curve indicates energy distribution; ETC drops fast with well-timed system.Isn't the pressure directly readable in VituixCAD impulse response window?
For example simulated 4-way with 4th order slopes (equal to Kef Reference 207/2). Peak pressure 134 mPa.
The same without XO i.e. minimum-phase response with HP at sub only. Pressure peak 198 mPa.
I would use excess group delay curve for XO tuning because it's more direct than traces in IR window.
GD & Phase of the first one.

Excess GD peak at 100 Hz of actual speaker (207/2) could be even higher, e.g. 8 ms.
My design target with IIR XO is much closer to 0 ms, but sometimes e.g. 1.8 ms at 100 Hz is inavoidable.
Excess GD peak at 100 Hz of actual speaker (207/2) could be even higher, e.g. 8 ms.
My design target with IIR XO is much closer to 0 ms, but sometimes e.g. 1.8 ms at 100 Hz is inavoidable.
Thanks. Yeah exactly, ~50% relative increase here in peak pressure between your examples. Although either might or might not have 'the feel" the higher pressure peak one is more likely to be felt, is the reasoning.Peak pressure is readable from left scale, but peak value is not very good benchmark because it's for example sensitive to frequency response at HF. ETC curve would be the most visual and easiest to monitor while changes and comparing to others, but unfortunately it's dB value normalized to 0 dB = peak pressure. Also shape of ETC curve indicates energy distribution; ETC drops fast with well-timed system.
For example simulated 4-way with 4th order slopes (equal to Kef Reference 207/2). Peak pressure 134 mPa.
View attachment 1056184
The same without XO i.e. minimum-phase response with HP at sub only. Pressure peak 198 mPa.
View attachment 1056185
I would use excess group delay curve for XO tuning because it's more direct than traces in IR window.
Context for all this arises from CTA2034 data and the preference rating number that is used in ASR forum gospel. It is possible to make speaker that has very high rating and good looking CTA 2034 graphs, while the timing discussed here is smeared it sounds boring/lame even though everything is technically correct and graphs look fine.Ehm, fyi the frequency response = impulse response = step response.
GD is derived from them as well. So we are looking at exactly the same thing, just in a different format basically.
I would dive into some Fourier Transform books, or rather Control Theory books (Control Systems Engineering by Norman Niseas is a good start) as well as digital signal processing (like; Digital Signal Filtering, Analysis and Restoration or so, but there are many others).
I can literally not make any sense what you're saying afterwards, it certainly does not involve group delay.
The physical pressure in sense of feel, that has been described, can certainly not be found in the things you're talking about.
It is possible to make speaker that has similarly good graphs with very high preference rating and sounds even better because the sound is now also felt, kind of, its more than just the sound, more exciting.
The polar responses might not be exactly the same, or DI has some wiggle or ER graphs not so nice or something so the responses are not exactly identical and could partially make why the perceived sound is different. The difference in these is not so much timbral, the other one is just more exciting and interesting sound drawing more attention, while the other can be quite flat and boring.
I don't have too much experience on this, few prorotypes and million xo versions (DSP) so trying to relate simulation graphs to perceived sound thats all. This group delay thing, perceived pressure on skin or where ever, seems logical. And shows that the preference rating doesn't correlate with sound quality in this respect.
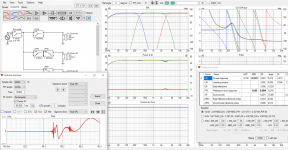
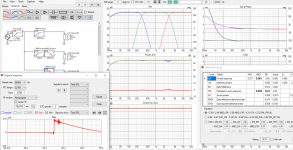
Quick experiment with ideal drivers, the peak pressure in impulse response window is not good indication for "the feel" as explained by kimmosto, too many things affect. Ironically in this ideal point source experiment with arbitrary filters and spacings all LR12 filters wins by reference rating 😀
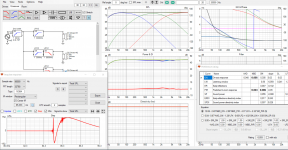
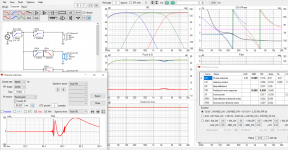
And here a real system with two different xo versions. These should be the "boring" and "lively" settings unless my memos are wrangled. Preference rating is about the same, power and DI smooth, all in all its the same speaker just different settings in the DSP. Both sound fine and nice but the other one is just alive having "the feel" when the other is boring sounding in comparison. While the difference could be anything as there is differences in the graphs it might be the timing. Excess group delay seems to be roughly the same on bass, while the other rises higher up in frequency. Hopefully sometime on summer holiday I've got time and energy to go back to these and weed out what makes the difference.
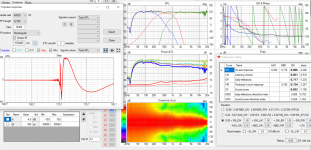
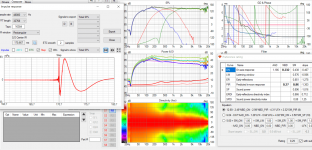


And here a real system with two different xo versions. These should be the "boring" and "lively" settings unless my memos are wrangled. Preference rating is about the same, power and DI smooth, all in all its the same speaker just different settings in the DSP. Both sound fine and nice but the other one is just alive having "the feel" when the other is boring sounding in comparison. While the difference could be anything as there is differences in the graphs it might be the timing. Excess group delay seems to be roughly the same on bass, while the other rises higher up in frequency. Hopefully sometime on summer holiday I've got time and energy to go back to these and weed out what makes the difference.


Last edited:
Hah, its fun to cycle these screenshots through, there is big difference on the last two in bass for example, which ought to contribute on the preference rating in simulator for example. In DSP i've adjusted the bass and if remember it is about same settings for both. I need to make the DSP settings back to simulator to reflect the actual situation and then see what the difference is.
Newbie question:
I am just starting to use VituixCad.
I built my crossover (using FRD and ZMA data) and got a VXP file. I also built my box and got a VXE file and a VXB file for my diffraction (baffle step).
How do I combine the Freq/SPL results of the VXP, VXE and VXB files so I get a single Freq/SPL curve with crossover response, baffle step and box response?
I can display the diffraction response in the enclosure but I cant do much beyond that.
Thanks in advance.
I don't know much about loudspeaker design, but this is a doubt I have been having for a while looking at the designing of speakers and their analysis based only on the SPL magnitude responses only by most people including at ASR. For the time being I am considering that the loudspeaker is a LTI system by neglecting the nonlinearities at different places in the signal path and the time varying nature caused by things like power compression etc.Ehm, fyi the frequency response = impulse response = step response.
GD is derived from them as well. So we are looking at exactly the same thing, just in a different format basically.
I would dive into some Fourier Transform books, or rather Control Theory books (Control Systems Engineering by Norman Niseas is a good start) as well as digital signal processing (like; Digital Signal Filtering, Analysis and Restoration or so, but there are many others).
I can literally not make any sense what you're saying afterwards, it certainly does not involve group delay.
The physical pressure in sense of feel, that has been described, can certainly not be found in the things you're talking about.
The LTI (linear time invariant) system theory tells us that impulse response characterizes an LTI system completely. Complex sinusoids being eigen functions of LTI systems, we get all information contained in the impulse response captured in the frequency response since Fourier transform is a unitary transformation. The (frequency domain) representation of the system (or the transfer function) using this eigen basis is also more instructive in audio since we can see exactly what is happening to the signal (at different frequencies) reproduced by the loudspeaker compared to the input signal by looking at the frequency response values at each frequency(eigen values). Of course, all this analysis applies only to one point in space. Now having constant directivity sort of also ensures that the frequency response variation at different points in space (at the same distance from the reference point of design of the loudspeaker) are scaled versions of the on-axis response. From an impulse response's perspective, this might look like a scaling of its amplitude/energy levels throughout the duration of its existence (as scaling in frequency domain causes scaling by the same factor in time domain).
Studying the frequency magnitude response around the crossover region may tell us how the phase match/mismatch at crossover region affects the summation of signals produced by the different drivers involved. But, to me, the frequency magnitude response (unless assuming minimum phase response throughout the bandwidth of interest) doesn't seem like telling anything explicitly about the group delay across frequencies which seems to affect the amount of energy arriving at the point of interest (in space) any time instant. This seems especially true when there is a lack of time alignment between the drivers as seen in the ideal drivers-based step response plots that tmuikku has shown in previous posts. The higher order crossover does seem to spread and delay the arrival of energy in time, and affecting the bass-mid range more. Maybe this can cause differenced in the presence/lack of liveliness between two non time aligned systems with identical SPL magnitude response,
In view of the above observations, looking at the phase response or a derived quantity from it such as group delay does seem to convey more information in an easier to understandable manner (especially if it has direct correlation with the auditory signal processing that comes later in the chain with the ear-brain combo) 😀
When we are using/designing/analyzing using the phase response/group delay/step response/impulse response along with the SPL magnitude response, at least we are making observations/inferences based on more 'complete' information rather than doing everything based on magnitude response alone.
All this is from an electrical engineering point of view since I don't have any clue about acoustics.. 😀
I myself feel that I have applied a lot of data compression on the information I tried to convey above (in addition to the fact that my native language is not English). Hopefully, at least some of it makes sense. 🙂
Member
Joined 2003
Newbie question:
I am just starting to use VituixCad.
I built my crossover (using FRD and ZMA data) and got a VXP file. I also built my box and got a VXE file and a VXB file for my diffraction (baffle step).
How do I combine the Freq/SPL results of the VXP, VXE and VXB files so I get a single Freq/SPL curve with crossover response, baffle step and box response?
I can display the diffraction response in the enclosure but I cant do much beyond that.
Thanks in advance.
Start here:
https://kimmosaunisto.net/Software/VituixCAD/VituixCAD_help_20.html#How_to_start_with_VituixCAD
Measurement and response processing process is detailed in the measurement documents for ARTA, REW, SoundEasy or Clio.
Been playing with question why the timing and related "pressure hit" is not good to be tested with headphones? Recent discussion on it here has been that there is the feel that would be missing, sensing with other parts of body than ears. Then bumped weltersys text on another thread which reads "... and similar to the way are hearing works-we can take handclaps and hammering nails at over 125dB peak without seeming too terribly loud, but a 1kHz sine wave at 100 dB does.", which makes sense having experienced hand claps and hammering.
Isn't it then that ear has some compression or some other protection system on it so that the "pressure hit" is just not coming through ears, headphone listening, and by that the audibility of group delay stuff is dependent on ear processing capability. But, we can sense it other ways making it not audible but sensible it seems. No wonder better performance on this respects would make loudspeaker sound more like a sensation, engaging, involving more senses. If we only could add nice scent and good taste to it as well it would be even greater sensation 😀 So, perhaps there is something to it, looking at the step or impulse response peak pressure in the simulator at some point? we can sense lot of pressure with our bodies, lets make it as high as possible! 🙂
Trying to reason on it so might be wrong conclusions. Anyone has more insight, good papers to read?
Last edited:
Well we also "hear" via our skull (Bones). The vibrations are conducted to our inner ear, and processed etc.
Low frequencies get sensed by our body more and more as the frequency drops. Just think about earth quake.
Low frequencies get sensed by our body more and more as the frequency drops. Just think about earth quake.
Yep, quick search found a study that says speech intelligibility increases as some sylables emit small air puffs along and if they were missing hearing system could mix up the letters 😀 visual cues could also change what was heard, quite interesting. We should make our loudspeakers as mouths puffing air so we could see them moving, scent and perhaps taste included! 😀 No, didn't find any studies regarding loudspeakers playback context.
A GD basically shifts the source in the rooms backwards a little, which has technically consequences for how the first few modes will interact, as well change the energy at the listening position (every so slightly).Listening position does not matter because pressure hit is almost pure direct sound if GD is quite constant down to LF. The first few reflections may alter the pressure after few ms.
Depending on the frequency, since the GD isn't constant.
So let's say difference of 2 ms which will give us x=v*t = 344*2E-3 = 69cm equivalent distance or so?
Anyway, similar tests like headphone tests can be done with a DSP and some speakers.
These days it's very easy to set up a ABX blind test as well.
I would recommend to do both (headphone as well as speakers)
Don't see how it's a bad excuse if things are artificial anyway.
Just for the idea and novelty that you can reproduce what's on the recording?
Which is a very alien concept, since that is not even how the guy behind the mixing table was hearing it.
Not taking local room acoustics and such in the equations.
Which will color the sound anyway, even with a "perfect" speaker.
Hack if we're talking about that level, even your sofa will color the sound.
Hell, even your ears will color the sound drastically, not to mention moods, lack of sleep etc etc.
Sorry, but I find that a very weak goal to reach and uninteresting subject to talk about,
but I guess I am to practical for these things.
Something that will an can only exist in theory.
Last edited:
Well, yes that's why we like to look at different graphs, not only in acoustics, to see different aspects of a system.I don't know much about loudspeaker design, but this is a doubt I have been having for a while looking at the designing of speakers and their analysis based only on the SPL magnitude responses only by most people including at ASR. For the time being I am considering that the loudspeaker is a LTI system by neglecting the nonlinearities at different places in the signal path and the time varying nature caused by things like power compression etc.
The LTI (linear time invariant) system theory tells us that impulse response characterizes an LTI system completely. Complex sinusoids being eigen functions of LTI systems, we get all information contained in the impulse response captured in the frequency response since Fourier transform is a unitary transformation. The (frequency domain) representation of the system (or the transfer function) using this eigen basis is also more instructive in audio since we can see exactly what is happening to the signal (at different frequencies) reproduced by the loudspeaker compared to the input signal by looking at the frequency response values at each frequency(eigen values). Of course, all this analysis applies only to one point in space. Now having constant directivity sort of also ensures that the frequency response variation at different points in space (at the same distance from the reference point of design of the loudspeaker) are scaled versions of the on-axis response. From an impulse response's perspective, this might look like a scaling of its amplitude/energy levels throughout the duration of its existence (as scaling in frequency domain causes scaling by the same factor in time domain).
Studying the frequency magnitude response around the crossover region may tell us how the phase match/mismatch at crossover region affects the summation of signals produced by the different drivers involved. But, to me, the frequency magnitude response (unless assuming minimum phase response throughout the bandwidth of interest) doesn't seem like telling anything explicitly about the group delay across frequencies which seems to affect the amount of energy arriving at the point of interest (in space) any time instant. This seems especially true when there is a lack of time alignment between the drivers as seen in the ideal drivers-based step response plots that tmuikku has shown in previous posts. The higher order crossover does seem to spread and delay the arrival of energy in time, and affecting the bass-mid range more. Maybe this can cause differenced in the presence/lack of liveliness between two non time aligned systems with identical SPL magnitude response,
In view of the above observations, looking at the phase response or a derived quantity from it such as group delay does seem to convey more information in an easier to understandable manner (especially if it has direct correlation with the auditory signal processing that comes later in the chain with the ear-brain combo) 😀
When we are using/designing/analyzing using the phase response/group delay/step response/impulse response along with the SPL magnitude response, at least we are making observations/inferences based on more 'complete' information rather than doing everything based on magnitude response alone.
All this is from an electrical engineering point of view since I don't have any clue about acoustics.. 😀
I myself feel that I have applied a lot of data compression on the information I tried to convey above (in addition to the fact that my native language is not English). Hopefully, at least some of it makes sense. 🙂
Frequency/magnitude response is one of them, but certainly not the only one.
There are many ways to measure the delay or time alignment between two drivers.
Since they will introduce a notch at a certain angle at some point.
Which can be calculated with;
D = v / (2*f*sin(a)) (d = distance, f = frequency with notch, a = angle in degrees, v = speed of sound)
This even can be simulated actually, which is reasonable accurate.
Especially when compared (and adjusted) to real measurements.
But to be really honest about it, for acoustics the fact is that a couple of things are heavily unknown.
The most important is the interaction between the speakers (or sound sources) in a certain room.
Or more specific how this interaction will actually sound.
Which makes the room always a variable in the equation.
Even worse when furniture and such are involved.
Second is the threshold of basically many things that is not really known.
Your summary is great, I don't really see any new information in it, except that it's nicely compressed like you said. 🙂
I think we have seen enough ignorance and belittling also here (not just on ASR). At least I'm ready to move back to VituixCAD.Sorry, but I find that a very weak goal to reach and uninteresting subject to talk about,
but I guess I am to practical for these things.
Something that will an can only exist in theory.
One of the latest studies.

Result with pink impulse:


I'm quite sure this will not end "practical ignorance" and selective blind and deaf faith in Toole et al.
Result with pink impulse:
I'm quite sure this will not end "practical ignorance" and selective blind and deaf faith in Toole et al.
- Home
- Design & Build
- Software Tools
- VituixCAD